Facts + Statistics: Tornadoes and thunderstorms

Convective storms

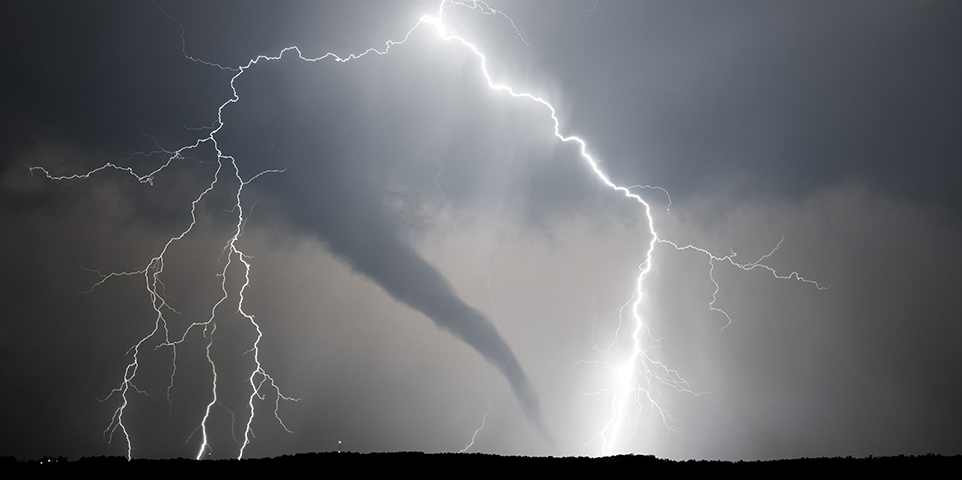
Convective storms result from warm, moist air rising from the earth, and depending on atmospheric conditions, may develop into tornadoes, hail, thunderstorms with lightning, or straight-line winds. Convective storms are the most common and damaging natural catastrophes in the United States, according to Triple-I’s May 2020 white paper, Severe convective storms: Evolving risks call for innovation to reduce costs, drive resilience.

Tornadoes

A tornado is a violently rotating column of air that extends from a thunderstorm and comes into contact with the ground, according to the National Oceanic and Atmospheric Administration (NOAA). In an average year, about 1,000 tornadoes are reported nationwide, according to NOAA. Tornado intensity is measured by the enhanced Fujita (EF) scale. The scale rates tornadoes on a scale of 0 through 5, based on the amount and type of wind damage. It incorporates 28 different damage indicators, based on damage to a wide variety of structures ranging from trees to shopping malls.

The Fujita Scale For Tornadoes

    Original F scale (1) Enhanced F scale (2)
Category Damage Wind speed (mph) 3-second gust (mph)
F-0 Light 40-72  65-85
F-1 Moderate 73-112 86-110
F-2 Considerable 113-157 111-135
F-3 Severe 158-207 136-165
F-4 Devastating 208-260 166-200
F-5 Incredible 261-318 Over 200

(1) Original scale: wind speeds represent fastest estimated speeds over one quarter of a mile.
(2) Enhanced scale: wind speeds represent maximum 3-second gusts.

Source: U.S. Department of Commerce, National Oceanic and Atmospheric Administration.


View Archived Graphs

Top 10 Costliest U.S. Catastrophes Involving Tornadoes (1)

($ millions)

        Estimated insured loss
Rank Date Event Location Dollars when
occurred
In 2023 dollars (2)
1 Aug. 8-12, 2020 Includes Aug. 10 Midwest Derecho IA, IL, IN, KS, MI, MN, MO, NE, OH,
SD, WI, PA, DC, MD, VA, WV
$9,200 $10,879
2 Apr. 22-28, 2011 Late April 2011 Super Tornado Outbreak AL, AR, GA, IL, KY, LA, MO, MS,
OH, OK, TN, TX, VA
7,560 10,346
3 May 21-27, 2011 Joplin, MO Tornado AR, GA, IA, IL, IN, KS, KY, MI, MN,
MO, NC, NE, NY, OH, OK, PA, TN,
TX, VA, WI
7,000 9,535
4 May 2-11, 2003 SCS Outbreak AL, AR, CO, GA, IA, IL, IN, KS, KY, MO,
MS, NC, NE, OH, OK, SC, SD, TN
3,300 5,535
5 Mar. 1-3, 2023 SCS Outbreak AL, AR, GA, IN, KY, MS, OH, PA, TN, VA 4,900 4,997
6 Mar. 31-Apr. 1, 2023 Tornado Outbreak AL, AR, DE, GA, IL, IN, IO, KY, MI, NE,
OH, PA, TN, TX
4,300 4,385
7 May 27-30, 2019 SCS Outbreak CO, TX, OK, KS, AR, MO, IA, IL, IN, OH, PA, WV, WY, NJ, NY 3,650 4,387
8 Jun. 21-26, 2023 SCS Outbreak TX, CO, Southeast 4,250 4,287
9 Apr. 10-15, 2016 San Antonio Hailstorm TX, LA, OK, AR, MS, KS, MO 3,200 4,117
10 Apr. 6-12, 2001 St. Louis Hailstorm AR, CO, IA, IL, IN, KS, MI, MN, MO, NE, OH, OK, PA, TX 2,200 3,828

(1) Defined by Aon as severe convective storms including insured thunderstorm events and may include tornado, hail, damaging straight-line winds (derechos) and flash flood impacts from events. Includes events that occurred through 2023. Subject to change as loss estimates are further developed. As of January 2024.
(2) Adjusted for inflation by Aon using the U.S. Consumer Price Index.

Source: Aon.

View Archived Tables

Top 10 States, By Number Of Tornadoes, 2023 (1)

Rank State Number of tornadoes (2) Fatalities
1 Illinois 136 4
2 Alabama 101 9
3 Colorado 89 0
3 Texas 89 8
5 Mississippi 81 24
5 Nebraska 81 0
7 Iowa 73 0
8 Georgia 58 1
9 Ohio 56 0
10 Tennessee 53 17

(1) Numbers include preliminary estimates as of January 2024.
(2) Excludes Puerto Rico. Tornadoes that cross state lines are counted in every state in which they touch down.

Source: U.S. Department of Commerce, Storm Prediction Center, National Weather Service.

View Archived Tables

Tornadoes And Related Deaths By State, 2023 (1)


State Tornadoes Fatalities Rank (2) State Tornadoes Fatalities Rank (2)
Alabama 101 9 101 Montana 4 0 4
Alaska 0 0 (3) Nebraska 81 0 81
Arizona 4 0 4 Nevada 3 0 3
Arkansas 36 4 36 New Hampshire 2 0 2
California 12 0 12 New Jersey 13 0 13
Colorado 89 0 89 New Mexico 14 0 14
Connecticut 2 0 2 New York 13 0 13
Delaware 5 1 5 North Carolina 14 0 14
D.C. 0 0 (3) North Dakota 5 0 5
Florida 47 0 47 Ohio 56 0 56
Georgia 58 1 58 Oklahoma 48 2 48
Hawaii 0 0 (3) Oregon 2 0 2
Idaho 5 0 5 Pennsylvania 26 0 26
Illinois 136 4 136 Rhode Island 2 0 2
Indiana 51 6 51 South Carolina 18 0 18
Iowa 73 0 73 South Dakota 17 0 17
Kansas 39 0 39 Tennessee 53 17 53
Kentucky 41 0 41 Texas 89 8 89
Louisiana 38 0 38 Utah 3 0 3
Maine 1 0 1 Vermont 2 0 2
Maryland 2 0 2 Virginia 8 0 8
Massachusetts 8 0 8 Washington 3 0 3
Michigan 19 2 19 West Virginia 0 0 0
Minnesota 25 0 25 Wisconsin 20 0 20
Mississippi 81 24 81 Wyoming 27 0 27
Missouri 27 5 27 United States (4) 1,423 83  

(1) Numbers include preliminary estimates as of January 2024. Ranked by total number of tornadoes.
(2) States with the same number of tornadoes receive the same ranking.
(3) State had no tornadoes in 2023.
(4) The U.S. total will not match data used in other charts because it counts tornadoes that cross state lines.

Source: U.S. Department of Commerce, Storm Prediction Center, National Weather Service.

View Archived Tables

Tornadoes And Related Deaths In The United States, 2004-2023 (1)


Year Tornadoes Deaths Year Tornadoes Deaths
2004 1,819 36 2014 886 47
2005 1,264 38 2015 1,177 36
2006 1,103 67 2016 976 18
2007 1,098 81 2017 1,429 35
2008 1,692 126 2018 1,126 10
2009 1,156 21 2019 1,517 42
2010 1,282 45 2020 1,082 76
2011 1,691 553 2021 1,314 103
2012 938 70 2022 1,143 23
2013 906 55 2023 1,294 83

(1) Numbers include actuals through September and preliminary estimates for October through December as of January 2024. Excludes Puerto Rico. Tornadoes that cross state lines are counted as a single event in this chart.

Source: U.S. Department of Commerce, Storm Prediction Center, National Weather Service.

View Archived Tables

U.S. Tornado Count, 2023


Source: U.S. Department of Commerce, National Oceanic and Atmospheric Administration, National Weather Service.

View Archived Graphs

Back to top