($ billions, 2014 dollars)
MEMBERSHIP
AMPLIFY
EN ESPAÑOL
Connect With Us
- Popular search terms
- Automobile
- Home + Renters
- Claims
- Fraud
- Hurricane
- Popular Topics
- Automobile
- Home + Renters
- The Basics
- Disaster + Preparation
- Life Insurance
($ billions, 2014 dollars)
(1) Does not include National Flood Insurance Program losses.
*Through 6/30/15 in 2015 dollars.
Note: 2001 figure includes $20.3B for 9/11 losses reported through 12/31/01 ($25.9B 2011 dollars). Includes only business and personal property claims, business interruption and auto claims. Non-prop/BI losses = $12.2B ($15.6B in 2011 dollars.)
Source: Property Claim Services (PCS®), a Verisk Analytics® business; AonBenfield; Insurance Information Institute. As of June 2015.
($ billions, 2013 dollars)
(1) $1 billion economic loss and/or 50 fatalities, as of January 7, 2014. Losses based on property losses including, if applicable, agricultural, offshore, marine, aviation and National Flood Insurance Program losses and may differ from data shown elsewhere.
Source: © 2014 Munich Re. NatCatSERVICE.
($ billions, 2011 dollars)
*PCS figure for Q1 2012.
Source: Property Claims Service/ISO; Insurance Information Institute. As of July 2012.
($ billions, 2012 dollars)
(1) Does not include National Flood Insurance Program losses.
*As of 1/2/13. Includes $18.8B gross loss estimate for Hurricane Sandy.
Note: 2001 figure includes $20.3B for 9/11 losses reported through 12/31/01 ($25.9B 2011 dollars). Includes only business and personal property claims, business interruption and auto claims. Non-prop/BI losses = $12.2B ($15.6B in 2011 dollars.)
Source: The Property Claim Services® (PCS®) unit of ISO®, a Verisk Analytics® company; Insurance Information Institute. As of January 2013.
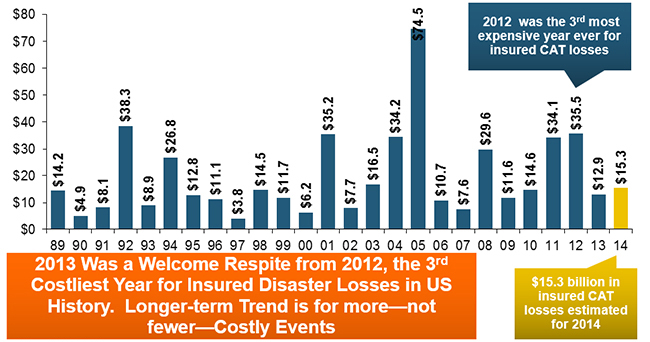
($ billions, 2013 dollars)
(1) Does not include National Flood Insurance Program losses.
*Through 12/31/14.
Note: 2001 figure includes $20.3B for 9/11 losses reported through 12/31/01 ($25.9B 2011 dollars). Includes only business and personal property claims, business interruption and auto claims. Non-prop/BI losses = $12.2B ($15.6B in 2011 dollars.)
Source: The Property Claim Services® (PCS®) unit of ISO®, a Verisk Analytics® company; Insurance Information Institute. As of January 2014.