Insurance Handbook

Premiums by State

Direct Premiums Written By State

Direct premiums written represent premium amounts before reinsurance transactions. This contrasts with charts based on net premiums written, i.e., premium amounts after reinsurance transactions.

Direct Premiums Written, P/C Insurance By State, 2022 (1)

($000)

State Total, all lines State Total, all lines
Alabama $11,716,215 Montana $3,463,887
Alaska 1,852,814 Nebraska 6,904,731
Arizona 15,629,400 Nevada 7,673,000
Arkansas 7,014,809 New Hampshire 3,045,198
California 104,899,591 New Jersey 26,686,284
Colorado 18,256,356 New Mexico 4,409,436
Connecticut 10,652,031 New York 58,997,898
D.C. 2,606,309 North Carolina 21,718,434
Delaware 3,515,643 North Dakota 3,628,847
Florida 75,754,056 Ohio 21,195,930
Georgia 29,010,823 Oklahoma 10,305,716
Hawaii 3,182,810 Oregon 9,365,253
Idaho 4,396,734 Pennsylvania 30,140,258
Illinois 33,307,419 Rhode Island 3,056,359
Indiana 14,924,567 South Carolina 13,282,307
Iowa 9,149,372 South Dakota 3,671,373
Kansas 8,890,216 Tennessee 15,563,305
Kentucky 9,271,062 Texas 80,475,416
Louisiana 14,812,427 Utah 7,181,285
Maine 3,002,428 Vermont 1,492,710
Maryland 14,860,314 Virginia 18,087,161
Massachusetts 19,648,888 Washington 16,580,372
Michigan 22,571,240 West Virginia 3,341,671
Minnesota 15,532,897 Wisconsin 13,366,412
Mississippi 6,847,421 Wyoming 1,593,760
Missouri 15,553,278 United States (2) $862,086,123

(1) Before reinsurance transactions, includes state funds, excludes territories.
(2) Data for the total United States may differ from similar data shown elsewhere due to the use of different exhibits from S&P Global Market Intelligence.

Source: NAIC data, sourced from S&P Global Market Intelligence, Insurance Information Institute.

View Archived Tables

Domestic Insurance Companies By State, Property/Casualty And Life/Annuities, 2022


State Property/casualty Life/annuities State Property/casualty Life/annuities
Alabama 19 8 Montana 14 2
Alaska 4 0 Nebraska 51 32
Arizona 53 30 Nevada 11 0
Arkansas 13 17 New Hampshire 47 0
California 90 16 New Jersey 64 3
Colorado 10 15 New Mexico 20 0
Connecticut 64 26 New York 165 78
Delaware 102 26 North Carolina 55 11
D.C 5 0 North Dakota 14 3
Florida 110 10 Ohio 148 40
Georgia 22 14 Oklahoma 36 23
Hawaii 15 4 Oregon 16 2
Idaho 10 1 Pennsylvania 140 20
Illinois 197 49 Rhode Island 20 1
Indiana 58 24 South Carolina 20 6
Iowa 73 34 South Dakota 16 2
Kansas 21 11 Tennessee 29 16
Kentucky 9 8 Texas 212 124
Louisiana 33 27 Utah 12 16
Maine 11 3 Vermont 11 1
Maryland 19 4 Virginia 19 2
Massachusetts 47 16 Washington 5 5
Michigan 64 20 West Virginia 22 1
Minnesota 39 8 Wisconsin 153 18
Mississippi 17 12 Wyoming 2 0
Missouri 49 28 United States (1) 2,456 817

(1) Excludes territories. Excludes health insurers, risk retention groups, fraternals, title and other insurers.

Source: 2022 Insurance Department Resources Report, published by the National Association of Insurance Commissioners (NAIC). Reprinted with permission. Further reprint or redistribution strictly prohibited without written permission of NAIC.

View Archived Tables

Direct Premiums Written, P/C Insurance By State, 2022 (1)

($000)

State Total, all lines State Total, all lines
Alabama $11,716,215 Montana $3,463,887
Alaska 1,852,814 Nebraska 6,904,731
Arizona 15,629,400 Nevada 7,673,000
Arkansas 7,014,809 New Hampshire 3,045,198
California 104,899,591 New Jersey 26,686,284
Colorado 18,256,356 New Mexico 4,409,436
Connecticut 10,652,031 New York 58,997,898
D.C. 2,606,309 North Carolina 21,718,434
Delaware 3,515,643 North Dakota 3,628,847
Florida 75,754,056 Ohio 21,195,930
Georgia 29,010,823 Oklahoma 10,305,716
Hawaii 3,182,810 Oregon 9,365,253
Idaho 4,396,734 Pennsylvania 30,140,258
Illinois 33,307,419 Rhode Island 3,056,359
Indiana 14,924,567 South Carolina 13,282,307
Iowa 9,149,372 South Dakota 3,671,373
Kansas 8,890,216 Tennessee 15,563,305
Kentucky 9,271,062 Texas 80,475,416
Louisiana 14,812,427 Utah 7,181,285
Maine 3,002,428 Vermont 1,492,710
Maryland 14,860,314 Virginia 18,087,161
Massachusetts 19,648,888 Washington 16,580,372
Michigan 22,571,240 West Virginia 3,341,671
Minnesota 15,532,897 Wisconsin 13,366,412
Mississippi 6,847,421 Wyoming 1,593,760
Missouri 15,553,278 United States (2) $862,086,123

(1) Before reinsurance transactions, includes state funds, excludes territories.
(2) Data for the total United States may differ from similar data shown elsewhere due to the use of different exhibits from S&P Global Market Intelligence.

Source: NAIC data, sourced from S&P Global Market Intelligence, Insurance Information Institute.

View Archived Tables

Premiums

Premiums By Line

Premiums can be accounted for in two major ways: net premiums written, which reflect premium amounts after deductions for reinsurance; and direct premiums written, which are calculated before reinsurance transactions.

Personal vs. Commercial

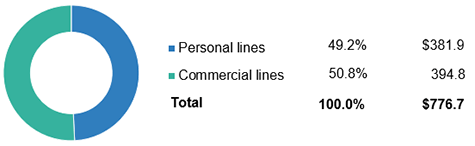
The property/casualty (P/C) insurance industry is divided into two main segments: personal lines and commercial lines. Personal lines include coverage for individuals, mainly auto and homeowners. Commercial lines include many kinds of insurance products designed for businesses.

Net Premiums Written, Personal And Commercial Lines, 2022

($ billions)

Source: NAIC data, sourced from S&P Global Market Intelligence, Insurance Information Institute.

View Archived Graphs

Net Premiums Written By Line, Property/Casualty Insurance, 2020-2022 (1)

($ millions)

        Percent change from
prior year
 
Lines of insurance 2020 2021 2022 2020 2021 2022 Percent of
total, 2022
Private passenger auto $243,651,281 $252,882,414 $268,045,439 -1.63% 3.79% 6.00% 34.51%
     Liability 144,102,547 148,417,736 155,139,440 -2.16 2.99 4.53 19.97
     Collision and comprehensive 99,548,734 104,464,678 112,905,999 -0.85 4.94 8.08 14.54
Homeowners multiple peril 96,337,734 103,388,421 113,858,720 4.39 7.32 10.13 14.66
Other liability (2) 69,379,884 84,584,864 94,186,453 14.69 21.92 11.35 12.13
Commercial auto 39,901,657 46,589,757 51,656,787 2.64 16.76 10.88 6.65
Commercial multiple peril 40,914,936 43,743,410 48,407,994 5.25 6.91 10.66 6.23
Workers compensation 42,614,903 43,137,129 47,547,324 -9.58 1.23 10.22 6.12
     Liability 30,005,121 35,469,922 39,381,556 2.64 18.21 11.03 5.07
Reinsurance (3) 18,918,325 20,634,051 24,032,117 28.22 9.07 16.47 3.09
Inland marine 14,880,594 17,618,563 21,241,774 -4.52 18.40 20.56 2.73
Fire 13,187,551 15,559,866 16,466,032 10.58 17.99 5.82 2.12
Allied lines  13,150,666 14,766,856 15,651,733 19.96 12.29 5.99 2.02
     Collision and comprehensive 9,896,536 11,119,835 12,275,231 2.66 12.36 10.39 1.58
Medical professional liability 9,047,840 10,001,987 10,576,645 4.10 10.55 5.75 1.36
Multiple peril crop 6,128,131 7,453,144 10,261,858 -5.31 21.62 37.68 1.32
Accident and health (4) 9,485,315 8,865,443 9,528,996 1.75 -6.54 7.48 1.23
Surety 6,677,154 7,110,412 8,237,722 1.92 6.49 15.85 1.06
Other lines (5) 1,448,177 6,568,314 1,646,926 -15.46 353.56 -74.93 0.21
International 326,356 5,387,728 305,604 -31.79 1550.87 -94.33 0.04
Farmowners multiple peril 4,436,804 5,343,486 5,636,129 2.70 20.44 5.48 0.73
Mortgage guaranty 4,765,343 4,684,479 4,274,086 -2.01 -1.70 -8.76 0.55
Ocean marine 3,441,080 3,900,882 4,129,969 8.15 13.36 5.87 0.53
Product liability 3,237,200 3,559,032 4,285,842 7.38 9.94 20.42 0.55
Boiler and machinery 2,827,603 3,369,342 3,641,220 10.88 19.16 8.07 0.47
Earthquake 2,349,315 2,894,251 3,058,911 20.13 23.20 5.69 0.39
Credit 1,792,462 1,826,121 2,157,639 -3.68 1.88 18.15 0.28
Aircraft 1,503,047 1,695,569 1,896,339 25.97 12.81 11.84 0.24
Warranty 1,238,136 1,426,670 1,238,289 7.17 15.23 -13.20 0.16
Fidelity 1,338,685 1,364,872 1,373,409 5.04 1.96 0.63 0.18
Excess workers compensation 886,907 929,024 965,606 -4.75 4.75 3.94 0.12
Private crop 623,990 711,267 1,015,832 -9.09 13.99 42.82 0.13
Private Flood 302,445 524,211 774,279 5.31 73.32 47.70 0.10
Burglary and theft 350,909 427,537 553,100 5.59 21.84 29.37 0.07
Financial guaranty 448,455 372,541 332,216 14.65 -16.93 -10.82 0.04
Federal flood (6) 14,019 16,738 -541 2.26 19.40 -103.23 (7)
Total, all lines (8)   $655,589,295 $715,950,614 $776,678,854 2.54% 9.21% 8.48% 100.00%

(1) After reinsurance transactions, excludes state funds.
(2) Coverages protecting against legal liability resulting from negligence, carelessness or failure to act.
(3) Only includes nonproportional reinsurance, an arrangement in which a reinsurer makes payments to an insurer whose losses exceed a predetermined amount.
(4) Premiums from certain insurers that write health insurance but file financial statements with state regulators on a property/casualty basis.
(5) Includes miscellaneous coverages.
(6) Provided by FEMA through participating private insurers.
(7) Less than 0.1 percent.
(8) May not match total premiums shown elsewhere in this book because of the use of different exhibits from SNL Financial LC.

Source: NAIC data, sourced from S&P Global Market Intelligence, Insurance Information Institute.

View Archived Tables

Direct Premiums Written, Property/Casualty Insurance, By State By Line, 2022 (1)

($000)

  Private passenger auto Commercial auto      
State Liability Coll./Comp. Liability Coll./Comp. Homeowners
multiple peril
Farmowners
multi peril
Commercial
multi peril
Alabama $2,182,999 $1,882,444 $610,897 $220,573 $2,337,365 $94,675 $821,398
Alaska 299,630 242,690 73,998 23,894 205,077 824 112,225
Arizona 3,800,911 2,684,468 883,672 216,563 2,335,487 19,954 834,032
Arkansas 1,205,673 1,135,557 370,958 162,330 1,227,304 89,332 453,981
California 17,829,570 14,851,319 5,772,260 1,400,012 12,375,311 228,279 6,536,784
Colorado 3,336,746 2,725,368 734,149 264,463 3,798,806 113,135 1,177,366
Connecticut 2,010,996 1,252,932 469,082 123,366 1,848,454 8,151 802,642
Delaware 661,325 334,717 166,338 35,905 382,057 9,026 338,672
D.C. 210,620 183,829 62,396 11,082 199,973 0 206,650
Florida 17,956,707 7,395,109 4,333,806 660,131 14,365,690 26,255 2,947,726
Georgia 7,371,055 3,889,786 2,071,833 438,153 4,591,153 168,597 1,482,926
Hawaii 444,796 392,196 104,073 31,941 461,010 0 238,795
Idaho 726,801 615,818 208,301 105,354 595,444 84,801 318,099
Illinois 4,459,710 4,028,198 1,944,724 690,546 4,880,305 233,479 2,220,963
Indiana 2,377,827 2,037,183 805,663 352,237 2,522,171 225,402 1,070,231
Iowa 947,440 1,156,164 375,749 240,129 1,089,486 271,310 591,024
Kansas 1,088,956 1,108,514 309,067 174,348 1,509,052 290,816 513,195
Kentucky 2,088,147 1,260,113 460,150 160,613 1,477,691 180,048 649,918
Louisiana 3,109,226 1,852,866 887,749 163,029 2,458,364 16,075 695,381
Maine 443,785 439,641 135,504 68,619 539,789 6,893 318,713
Maryland 3,328,950 2,383,728 742,727 219,293 2,462,179 33,994 809,658
Massachusetts 3,092,551 2,608,985 853,930 318,180 3,055,387 4,990 1,658,969
Michigan 5,247,376 3,980,606 955,007 451,222 3,458,624 161,823 1,402,357
Minnesota 2,195,444 2,113,611 559,546 300,743 2,974,121 191,955 942,030
Mississippi 1,192,230 1,056,561 425,811 142,981 1,323,063 33,167 444,598
Missouri 2,511,086 2,226,119 702,483 318,222 2,747,131 227,842 1,050,224
Montana 438,820 501,833 149,824 94,484 526,604 104,613 265,933
Nebraska 742,582 765,398 241,646 163,929 1,071,005 308,695 394,545
Nevada 2,188,685 923,193 629,483 87,131 842,708 8,368 464,248
New Hampshire 479,137 500,276 135,645 56,985 522,142 3,595 314,636
New Jersey 5,539,185 2,900,087 1,882,944 324,627 3,418,762 4,276 1,935,612
New Mexico 986,327 697,435 247,902 72,811 726,198 30,983 298,334
New York 9,655,254 5,620,328 2,863,186 471,185 6,814,557 54,883 5,037,255
North Carolina 3,761,045 3,851,968 1,111,809 390,993 3,729,599 71,092 1,290,199
North Dakota 227,798 320,580 108,622 88,941 282,639 148,444 181,405
Ohio 3,854,310 3,478,116 1,195,219 460,298 3,680,758 199,043 1,616,230
Oklahoma 1,610,834 1,534,331 498,539 197,821 2,141,649 197,395 709,687
Oregon 2,165,992 1,205,642 470,637 150,991 1,209,347 91,969 673,263
Pennsylvania 4,933,081 4,673,627 1,579,341 620,222 4,232,845 118,720 2,251,953
Rhode Island 658,603 375,251 121,554 38,803 540,047 552 215,011
South Carolina 3,297,761 1,921,135 625,645 178,553 2,384,267 21,268 716,383
South Dakota 278,355 416,361 103,974 88,753 373,652 162,058 202,173
Tennessee 2,677,706 2,462,371 745,862 328,855 2,764,344 182,237 1,029,763
Texas 14,514,450 11,988,893 5,304,970 1,346,466 13,448,367 435,276 4,106,101
Utah 1,680,595 1,018,713 386,656 132,699 827,919 20,811 424,853
Vermont 178,484 226,418 59,183 34,376 246,415 17,083 166,782
Virginia 3,647,090 2,941,252 832,300 297,539 3,135,437 88,889 1,075,860
Washington 3,719,244 2,250,999 847,563 267,408 2,484,205 91,900 1,161,734
West Virginia 677,015 648,801 157,151 61,623 526,075 18,898 251,393
Wisconsin 1,819,037 1,808,011 574,354 305,798 1,873,384 218,798 923,200
Wyoming 195,126 293,855 77,464 49,527 294,939 39,841 142,096
United States $160,047,070 $117,163,395 $45,971,344 $13,604,748 $133,318,353 $5,360,511 $54,487,203

(1) Includes some state funds.

Source: NAIC data, sourced from S&P Global Market Intelligence, Insurance Information Institute.

View Archived Tables

Direct Premiums Written, Property/Casualty Insurance, By State By Line, 2022 (1) (Cont’d)

($000)

State Workers
compensation
Excess workers
compensation
Medical
professional liability
Product
liability
Other
liability
Fire Allied lines
Alabama $418,003 $22,126 $170,446 $52,833 $1,057,561  $330,316 $348,894
Alaska 182,521 3,913 25,118 6,938 203,924 69,143 42,640
Arizona 865,450 17,292 239,672 80,409 1,694,933 237,095 238,405
Arkansas 254,552 8,450 79,762 24,944 643,086 220,287 191,221
California 11,631,091 233,980 968,362 699,507 16,001,244 2,516,500 1,471,882
Colorado 1,027,206 17,283 187,932 100,438 2,231,996 316,167 359,894
Connecticut 742,221 23,222 253,052 59,606 1,667,154 188,540 196,443
Delaware 189,781 2,015 37,766 15,771 748,056 44,656 36,600
D.C. 158,900 4,977 32,316 10,664 779,639 69,634 59,585
Florida 3,248,415 76,572 915,063 327,171 9,293,948 1,958,801 4,858,552
Georgia 1,827,359 44,727 401,916 139,218 3,018,153 548,080 476,672
Hawaii 321,921 8,547 40,129 11,885 429,003 144,044 184,454
Idaho 620,311 1,993 42,352 24,805 387,988 71,084 59,409
Illinois 2,417,169 55,555 546,501 219,952 5,657,033 772,979 526,553
Indiana 839,865 15,338 165,161 131,304 1,471,076 402,286 272,495
Iowa 696,353 10,500 75,120 50,515 897,513 227,016 207,964
Kansas 412,216 9,376 100,552 41,127 705,424 164,648 239,319
Kentucky 552,990 15,161 133,802 36,588 774,473 199,819 172,803
Louisiana 874,834 52,608 116,076 53,101 1,315,676 578,887 923,737
Maine 280,333 3,515 52,816 13,153 269,094 68,036 62,196
Maryland 920,566 14,624 372,609 59,322 1,657,517 228,771 204,554
Massachusetts 1,350,910 25,031 363,551 151,017 3,471,020 428,483 410,591
Michigan 1,036,807 26,188 251,152 123,385 2,110,806 442,253 278,359
Minnesota 994,192 1,480 103,419 115,990 1,798,030 321,761 449,568
Mississippi 347,296 10,743 58,032 21,534 486,245 210,247 214,627
Missouri 1,038,287 36,216 202,794 76,246 1,678,213 352,647 327,107
Montana 287,703 5,341 40,887 15,734 294,655 59,094 59,725
Nebraska 391,080 5,266 49,813 26,301 530,609 119,152 140,827
Nevada 461,468 21,246 99,791 41,580 866,711 158,722 124,944
New Hampshire 228,355 6,617 58,752 17,120 317,626 54,142 43,582
New Jersey 2,586,376 38,514 522,667 219,356 3,884,570 520,179 443,638
New Mexico 297,774 6,002 66,601 13,554 357,156 68,171 67,118
New York 5,109,705 58,140 1,764,356 328,002 13,017,859 1,249,357 1,006,476
North Carolina 1,446,028 25,973 199,331 130,637 2,204,757 456,949 530,815
North Dakota 5,322 5 13,869 16,040 233,681 67,155 59,328
Ohio 18,884 77,706 265,015 147,940 2,581,085 551,747 420,180
Oklahoma 639,592 10,912 116,424 44,849 849,510 270,589 311,971
Oregon 752,076 9,142 116,605 65,475 986,386 190,943 131,329
Pennsylvania 2,507,256 39,320 912,565 167,095 4,286,908 631,751 488,602
Rhode Island 225,045 2,371 37,431 13,692 382,433 58,984 68,876
South Carolina 865,821 11,657 90,527 68,404 1,012,219 450,124 304,680
South Dakota 181,201 1,792 18,312 17,508 196,905 58,345 60,871
Tennessee 826,133 18,925 263,279 96,570 1,667,967 411,460 367,916
Texas 2,560,211 28,668 506,576 421,162 9,465,243 2,984,814 2,682,745
Utah 549,394 5,056 79,530 55,941 904,213 131,557 87,869
Vermont 176,159 1,944 21,141 8,824 148,227 31,407 23,202
Virginia 1,007,109 22,513 234,256 74,366 2,216,993 314,567 301,427
Washington 26,160 33,352 232,144 103,613 2,172,440 374,306 259,327
West Virginia 244,923 5,868 72,142 9,699 268,570 77,927 52,774
Wisconsin 1,975,250 11,671 86,694 110,384 1,514,626 311,566 253,270
Wyoming 5,596 131 19,837 6,967 168,497 35,772 33,052
United States $56,624,168 $1,189,563 $11,824,013 $4,868,235 $110,978,652 $20,750,960 $21,139,068

(1) Includes some state funds.

Source: NAIC data, sourced from S&P Global Market Intelligence, Insurance Information Institute.

View Archived Tables

Direct Premiums Written, Property/Casualty Insurance, By State By Line, 2022 (1) (Cont’d)

($000)

State Inland marine Ocean marine Surety Fidelity Burglary
and theft
Boiler and
machinery
Financial
guaranty
Alabama $470,874 $58,994 $109,808 $14,250 $5,841 $36,438 $2,739
Alaska 93,244 44,606 39,970 2,877 940 13,711 193
Arizona 595,512 37,252 164,241 17,232 8,537 32,200 1,272
Arkansas 303,073 24,133 51,927 9,834 3,122 24,494 446
California 4,210,437 487,834 1,050,332 171,936 66,915 198,359 63,924
Colorado 675,817 28,277 198,248 29,014 9,532 34,722 4,586
Connecticut 451,967 95,825 73,319 28,584 7,363 26,869 2,053
Delaware 175,866 16,467 31,507 6,586 2,014 8,011 18,309
D.C. 162,854 7,412 226,402 17,595 4,793 7,832 6,749
Florida 2,211,430 620,943 560,481 76,040 32,922 97,838 7,234
Georgia 1,021,246 90,225 223,857 37,355 19,612 73,517 771
Hawaii 0 26,001 0 4,739 1,239 7,232 3,702
Idaho 177,391 15,468 34,683 3,890 1,801 13,712 38
Illinois 1,144,059 203,510 289,596 76,457 34,904 103,695 8,919
Indiana 529,223 37,951 130,340 20,639 9,650 57,346 1,989
Iowa 307,608 13,466 64,194 13,836 4,359 33,625 1,191
Kansas 268,481 13,170 58,879 12,551 5,092 29,091 1,431
Kentucky 351,861 36,878 88,089 10,956 4,513 40,832 4,757
Louisiana 582,702 171,832 152,499 14,640 5,879 53,014 1,578
Maine 129,521 41,914 26,358 5,327 1,053 12,071 505
Maryland 531,288 139,223 228,580 28,279 10,077 35,603 1,613
Massachusetts 817,787 145,445 182,289 58,543 14,269 52,373 4,496
Michigan 777,947 133,013 141,367 36,409 15,454 87,203 5,179
Minnesota 535,501 43,637 94,229 30,264 10,795 53,609 644
Mississippi 301,055 29,413 60,002 8,027 2,522 19,351 263
Missouri 552,637 49,980 103,970 26,836 9,465 41,798 6,494
Montana 125,929 5,572 43,439 3,714 1,877 8,187 219
Nebraska 241,349 6,671 52,818 8,678 2,763 19,659 935
Nevada 285,477 10,474 104,875 8,491 4,036 19,429 540
New Hampshire 144,307 17,723 23,792 6,164 1,600 9,667 0
New Jersey 1,038,522 210,374 209,883 47,618 17,068 67,500 5,466
New Mexico 152,825 3,401 64,478 4,625 1,232 10,854 228
New York 2,392,776 527,766 601,256 184,467 47,082 155,560 134,855
North Carolina 999,223 118,640 224,631 44,082 14,278 60,795 2,801
North Dakota 110,895 2,788 31,817 3,373 951 17,528 473
Ohio 905,364 80,318 183,090 43,799 25,497 97,774 2,305
Oklahoma 350,657 19,923 91,415 13,353 3,794 28,056 88
Oregon 406,166 45,364 116,146 11,938 5,590 28,491 262
Pennsylvania 1,138,753 101,141 296,698 57,361 21,940 101,040 19,677
Rhode Island 115,486 40,133 30,075 5,465 1,960 9,611 0
South Carolina 533,861 52,050 107,829 12,474 5,121 34,918 5,105
South Dakota 99,047 1,971 32,700 3,658 933 10,854 254
Tennessee 673,936 93,460 139,191 22,414 10,211 46,394 218
Texas 3,292,897 418,910 907,329 96,476 57,699 200,539 35,410
Utah 284,216 22,613 78,802 10,462 4,021 16,743 213
Vermont 69,559 4,139 9,735 2,542 768 6,566 40
Virginia 733,845 134,942 237,173 38,906 14,175 46,773 483
Washington 879,790 191,007 177,463 24,127 9,598 45,588 792
West Virginia 101,588 4,883 48,755 4,216 889 12,109 229
Wisconsin 470,785 57,557 79,568 26,117 10,405 62,385 1,012
Wyoming 71,788 1,313 58,151 1,769 539 11,672 0
United States $32,998,422 $4,786,003 $8,336,276 $1,448,985 $556,688 $2,323,239 $362,677

(1) Includes some state funds.

Source: NAIC data, sourced from S&P Global Market Intelligence, Insurance Information Institute.

View Archived Tables

Direct Premiums Written, Property/Casualty Insurance, By State By Line, 2022 (1) (Cont'd)

($000)

State Aircraft Earthquake Federal flood Credit Warranty Accident and health
Alabama $29,225 $10,516 $27,066 $43,696 $16,442 $110,832
Alaska 70,292 55,277 745 3,107 567 12,003
Arizona 76,087 19,644 13,528 22,239 35,960 133,079
Arkansas 36,559 50,713 8,559 21,562 10,507 61,325
California 261,210 2,959,348 121,951 195,426 275,137 791,834
Colorado 84,036 17,161 11,024 33,478 41,224 107,368
Connecticut 35,749 13,895 34,370 34,632 11,930 67,986
Delaware 24,141 1,912 13,705 14,458 31,323 122,758
D.C. 5,718 5,514 1,020 22,183 64 96,394
Florida 230,097 46,594 897,334 166,469 844,476 334,115
Georgia 87,748 22,143 40,589 62,331 56,013 211,360
Hawaii 13,224 25,630 33,046 8,889 2,887 10,951
Idaho 23,884 10,239 3,321 5,761 3,664 30,574
Illinois 105,862 114,174 20,580 94,591 337,908 389,756
Indiana 40,460 54,399 11,724 40,561 46,913 421,279
Iowa 20,390 7,435 8,740 21,374 4,377 83,569
Kansas 34,114 10,405 5,123 24,451 212,842 71,280
Kentucky 13,595 56,610 11,773 41,057 10,177 81,372
Louisiana 50,863 7,723 259,323 33,050 6,897 87,627
Maine 7,733 2,782 6,198 8,022 6,131 15,420
Maryland 35,370 16,951 23,486 20,628 20,434 83,874
Massachusetts 47,821 42,252 51,149 55,045 43,734 131,025
Michigan 47,616 11,282 11,931 53,533 578,421 183,822
Minnesota 49,769 6,128 5,214 26,419 21,885 83,935
Mississippi 20,504 28,094 37,393 25,268 4,981 63,347
Missouri 30,850 137,690 15,052 40,048 33,504 165,350
Montana 23,162 9,447 2,383 1,682 807 23,965
Nebraska 23,809 2,996 5,196 7,690 4,241 94,320
Nevada 45,377 61,116 5,770 5,703 2,751 33,524
New Hampshire 13,624 2,759 6,157 14,436 5,089 23,966
New Jersey 32,671 46,115 153,603 96,205 46,285 200,655
New Mexico 13,851 4,857 6,555 8,336 5,753 33,761
New York 80,691 94,656 148,751 258,396 73,602 676,182
North Carolina 70,421 23,483 76,501 48,136 52,512 180,253
North Dakota 13,982 925 4,299 1,964 1,114 10,855
Ohio 100,574 40,693 19,504 76,770 83,451 245,954
Oklahoma 30,067 18,979 6,552 25,304 11,241 65,908
Oregon 48,997 162,088 14,516 10,749 7,775 74,220
Pennsylvania 60,111 27,387 44,643 67,977 63,214 341,054
Rhode Island 10,812 3,521 9,810 7,332 3,587 50,258
South Carolina 25,192 61,840 93,409 26,486 13,016 82,618
South Dakota 14,383 928 2,065 7,278 2,856 15,219
Tennessee 56,192 128,858 19,078 50,062 17,850 168,752
Texas 290,932 58,502 387,537 622,495 253,578 568,114
Utah 41,279 117,289 1,823 21,896 73,641 47,648
Vermont 3,149 1,926 3,609 3,077 8,022 19,402
Virginia 62,580 27,889 48,801 54,878 27,407 139,674
Washington 55,876 365,264 20,893 33,491 130,458 88,900
West Virginia 4,771 1,691 10,501 8,481 4,701 35,564
Wisconsin 34,136 9,754 7,545 27,054 52,293 136,913
Wyoming 11,564 6,402 1,061 2,642 922 18,402
United States $2,651,122 $5,013,872 $2,774,506 $2,606,801 $3,604,564 $7,328,317

(1) Includes some state funds.

Source: NAIC data, sourced from S&P Global Market Intelligence, Insurance Information Institute.

View Archived Tables

Direct Premiums Written, Property/Casualty Insurance, By State By Line, 2022 (1) (Cont'd)

($000)

State Multiple peril crop Private crop Mortgage guaranty Miscellaneous Private flood
Alabama $111,401 $1,085 $35,355 $66,127 $14,593
Alaska 142 0 2,076 17,569 2,960
Arizona 128,753 4,211 12,995 148,499 18,821
Arkansas 253,651 34,283 10,606 37,475 5,075
California 632,398 13,723 126,467 504,379 113,701
Colorado 362,345 19,207 44,026 138,799 17,652
Connecticut 9,542 1 7,058 74,484 19,859
Delaware 16,110 173 2,243 22,047 4,380
D.C. 0 0 25,563 21,512 4,085
Florida 205,035 613 264,038 447,263 247,186
Georgia 311,265 3,800 41,881 202,974 22,980
Hawaii 1,980 0 2,577 18,961 12,884
Idaho 151,327 15,446 3,148 36,159 3,430
Illinois 1,247,206 155,739 42,115 246,120 34,609
Indiana 643,109 41,972 17,317 113,265 17,978
Iowa 1,516,334 145,836 8,145 51,780 6,325
Kansas 1,341,995 73,488 8,713 45,630 5,344
Kentucky 260,357 9,031 5,377 48,416 10,505
Louisiana 154,388 5,503 24,693 63,413 28,920
Maine 12,289 0 1,411 18,812 2,778
Maryland 48,514 153 24,234 158,205 13,322
Massachusetts 4,949 0 42,989 114,437 32,668
Michigan 318,282 8,776 42,525 177,187 14,813
Minnesota 1,152,008 160,166 39,777 148,591 8,430
Mississippi 210,038 5,018 27,728 27,393 9,500
Missouri 640,782 44,612 48,034 94,220 12,187
Montana 345,575 636 1,966 15,980 3,208
Nebraska 1,043,545 392,139 8,922 33,681 4,398
Nevada 68,423 4,899 4,347 76,881 8,001
New Hampshire 747 0 3,714 28,570 3,421
New Jersey 7,721 0 32,298 165,972 74,996
New Mexico 117,058 2,542 7,563 30,096 4,881
New York 96,110 428 166,050 201,785 94,008
North Carolina 356,007 5,069 29,795 178,762 28,059
North Dakota 1,535,938 119,809 840 16,103 1,362
Ohio 470,604 19,141 50,518 177,057 25,336
Oklahoma 422,180 7,218 15,227 52,163 7,159
Oregon 105,186 4,418 7,833 83,863 11,502
Pennsylvania 81,648 897 32,659 195,043 39,182
Rhode Island 131 0 2,519 17,164 6,364
South Carolina 127,124 329 10,425 91,463 28,939
South Dakota 1,213,755 88,074 2,143 13,636 1,268
Tennessee 145,913 3,874 16,807 105,447 18,337
Texas 2,122,501 35,544 116,253 517,355 131,336
Utah 31,766 435 11,100 73,757 4,533
Vermont 6,290 0 269 11,609 1,917
Virginia 105,090 1,455 35,060 165,351 20,648
Washington 301,570 18,790 22,892 167,055 19,016
West Virginia 4,174 9 2,876 16,849 6,522
Wisconsin 456,518 21,256 12,144 104,495 10,099
Wyoming 30,944 1,874 280 9,455 1,642
United States $18,930,718 $1,471,672 $1,505,592 $5,593,310 $1,241,121

(1) Includes some state funds.

Source: NAIC data, sourced from S&P Global Market Intelligence, Insurance Information Institute.

View Archived Tables

Premium Taxes by State

All insurance companies pay a state tax based on their premiums. Other payments are made to states for licenses and fees, income and property taxes, sales and use taxes, unemployment compensation taxes and franchise taxes.

Premium Taxes By State, Property/Casualty, Life/Annuity and Health Insurers, 2022 (1)

($000)

State Amount State Amount
Alabama  $513,226 Montana $153,056
Alaska 68,590 Nebraska 78,815
Arizona 732,224 Nevada 518,019
Arkansas 345,234 New Hampshire 136,733
California 3,319,048 New Jersey  747,723
Colorado 338,355 New Mexico 235,866
Connecticut 191,176 New York  2,409,677
Delaware 146,051 North Carolina 1,003,553
D.C. 148,438 North Dakota 75,216
Florida 1,571,412 Ohio 675,158
Georgia 482,092 Oklahoma 349,723
Hawaii 201,859 Oregon 85,403
Idaho 137,183 Pennsylvania 913,085
Ilinois 491,053 Rhode Island 159,612
Indiana 257,529 South Carolina 289,114
Iowa 152,546 South Dakota 97,571
Kansas 466,396 Tennessee 1,223,183
Kentucky 179,015 Texas 3,121,923
Louisiana 1,080,293 Utah 189,609
Maine 136,120 Vermont 68,799
Maryland 791,320 Virginia 683,923
Massachusetts 587,997 Washington 823,878
Michigan 398,371 West Virginia 135,847
Minnesota 718,431 Wisconsin 247,174
Mississippi 383,652 Wyoming 33,611
Missouri 465,920 United States $28,759,802

(1) Includes other insurance companies. Data are for each state's fiscal year.

Source: U.S. Department of Commerce, Bureau of the Census.

View Archived Tables

  • Insurance companies—including life insurance and annuity providers, health, property/casualty, and other companies—paid $28.8 billion in premium taxes to the 50 states and the District of Columbia in 2022. The per capita basis is $86 for everyone in the United States.
  • Premium taxes accounted for 2 percent of all taxes collected by the states and the District of Columbia in 2022.