Highlights
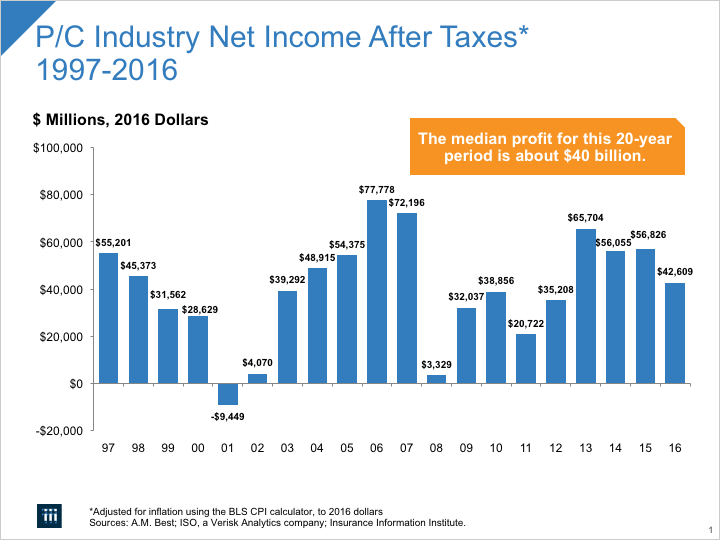
U.S. economic activity slowed somewhat in 2016 compared to 2015—real GDP rose by 1.6 percent in 2016 vs. 2.6 percent in 2015—and the property/casualty (P/C) insurance industry’s results followed suit. The industry’s $42.6 billion profit for the full year 2016 was 25 percent lower than the $56.8 billion profit for 2015. But this result should be viewed in the context of the last 20 years (adjusted for inflation); in which case the 2016 profit is the median result (Figure 1). Expressed as a percentage of net worth (average surplus, for property/casualty insurers), the industry posted a 6.2 percent mark for 2016, down from 8.4 percent in 2015 (and 2014).
Fig. 1
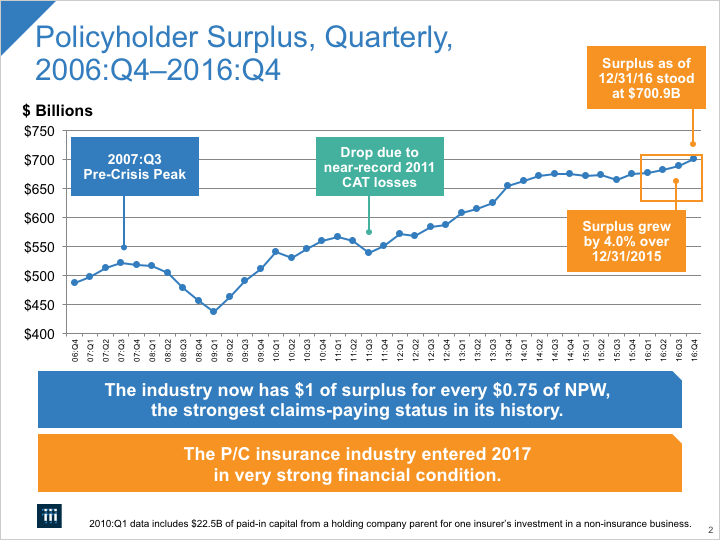
Challenged by continuing low interest rates, weak domestic and global economic growth and rising claims, the industry nevertheless posted a modest 2.7 percent net written premium growth (compared to 3.5 percent in 2015), and overall industry capacity (policyholder surplus) rose to $700.9 billion (up 4.0 percent) as of December 31, 2016. This is a new peak for industry surplus (Figure 2).
Fig. 2
The industry results were released by ISO, a Verisk Analytics company, and the Property Casualty Insurers Association of America (PCI).
Insurance performance and profitability drivers
The industry’s performance in 2016 could be characterized as its “new normal,” neither as profitable as in 2013-15 nor as affected by catastrophes as in 2011-12.
Premiums: Top Line Growth Continues, But Slows
P/C insurers measure premium income in three ways, each of which gives a different insight into the industry’s activity. Direct premiums are amounts that policyholders pay. This is a basic gauge of “retail” activity. Net written premiums are calculated by subtracting amounts insurers pay for reinsurance from direct premiums, and are therefore a simple gauge of the net amount of risk that insurers planned to assume. Net earned premiums are derived by adjusting net written premiums to reflect the insurance actually provided.
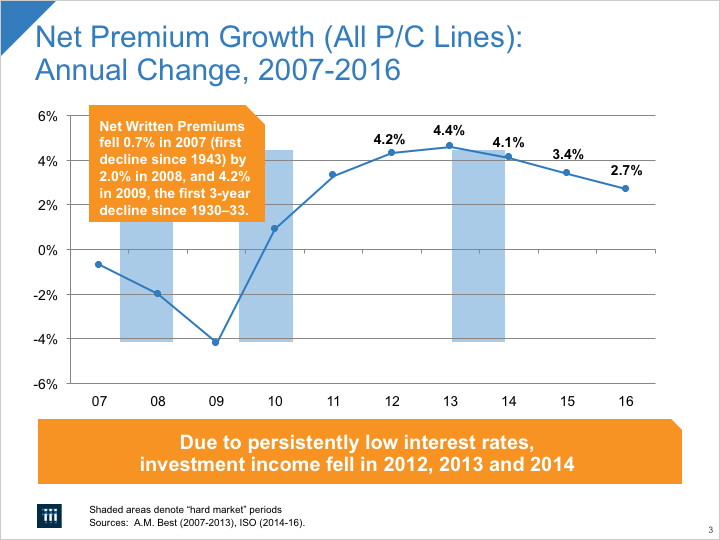
Direct premiums grew by 3.8 percent in 2016 over 2015—nearly the same growth rate as in 2015 over 2014. In contrast, net written premiums in 2016 rose by $13.8 billion, or 2.7 percent, to $528.2 billion. The rate of increase in net written premiums has been trending down for several years (Figure 3), due mainly to soft markets in the commercial lines. Net earned premium growth also slowed in 2016 (growing by 3.5 percent) compared to 2015 (3.7 percent growth over 2014).
Fig. 3
There are two main drivers of premium growth in property/casualty insurance: exposure growth and rate. Exposure growth—basically an increase in the number and/or value of insurable interests (such as property and liability risks)—is determined mainly by inflation and by the health and growth of the U.S. economy (including factors such as population growth and composition, household formation, housing preferences and more). By most measures, inflation continued to be remarkably low; the Consumer Price Index for 2016 was near 1.3 percent. As noted, real (inflation-adjusted) GDP growth in 2016 was 1.6 percent, although the annual rate masked starts and stops during the year (2016:Q1 growth rate was 0.8 percent; 2016:Q2 was 1.4 percent; 2016:Q3 was 3.5 percent; 2016:Q4 was 2.1 percent, all expressed at annual rates).
Exposure growth in key areas of the economy such as new vehicle sales (at near-record levels), business investment, industrial production, construction and overall employment growth raised the value of exposures covered by the P/C insurance industry. With real GDP growth expected (at this writing) to continue at a moderate pace in 2017 (in the range of 2.0 to 2.4 percent), and inflation expected to continue at roughly 2 percent, nominal values of personal and commercial lines exposures—and the premiums they generate—should continue to rise in the 4.0 to 4.5 percent range. Accordingly, the growth rate of premiums for personal lines and commercial lines will depend on rate changes. If the soft market in commercial lines continues, overall industry premium growth could continue to slightly lag the rate of overall economic growth in 2017, as was the case in 2016.
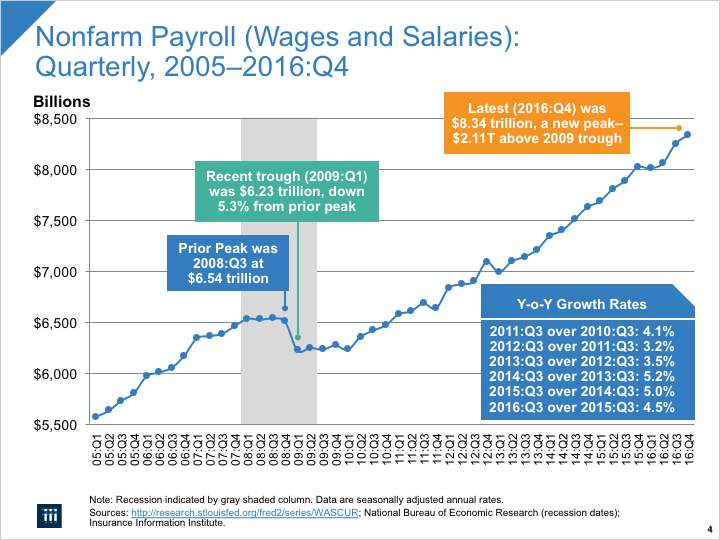
Continuing improvement in labor market conditions in 2016 also aided top line growth in the P/C insurance industry. Job growth benefits the entire economy, of course, but it directly affects workers compensation insurers. The number of people employed in full-time jobs (seasonally adjusted) hit a new peak in August 2016 (124.26 million) and was up another 1.25 million by the end of the first quarter of 2017.
Combined with pay raises for continuing workers, payrolls rose $316.5 billion by year-end 2016, up 3.9 percent (Figure 4), driving billions of dollars in new premiums for workers compensation coverage in 2016. This job growth is likely to continue, though at a somewhat slower pace; economists believe that the economy is getting close to full employment, but there still appears to be slack in the labor market (for example, the number of “involuntary part-time” workers is still above its typical level for prosperous times) and wage increases appear to be only slightly higher than the rate of inflation. As a result, if economic growth and hiring continue as projected, workers compensation exposure is likely to remain among the faster growing major commercial P/C lines of insurance in 2017.
Fig. 4
The other major determinant of industry premium growth is rate activity. Rates are a function of a number of forces, but perhaps the most important is past and expected-future claims. Net of reinsurance recoveries, incurred losses and loss adjustment expenses for all lines in 2016 rose to $378.3 billion, up 8.0 percent from $350.3 billion in 2015. Overall, the growth in claims expenses (losses and loss adjustment expenses) far outpaced the growth in premiums.
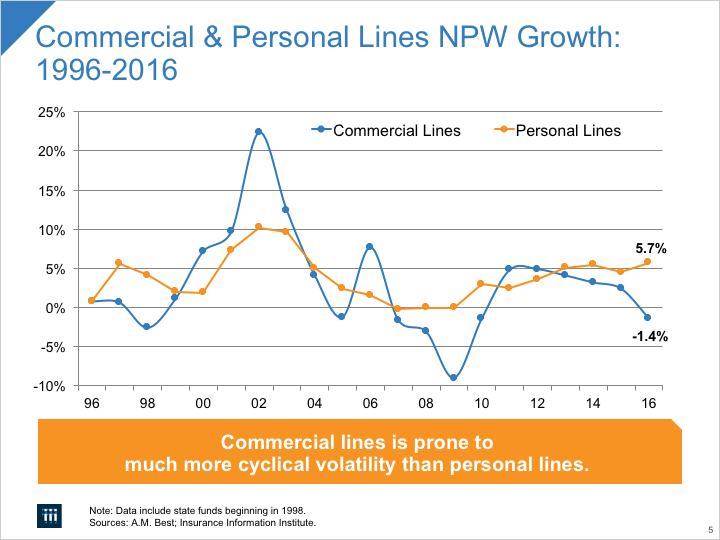
ISO/PCI reported that premium growth in 2016 was significantly different for the personal lines vs. commercial lines sectors. Insurers writing primarily personal lines saw premium growth of 5.7 percent—up from 5.2 percent in 2015. Insurers writing primarily commercial lines saw premium shrinkage in 2016 by -1.4 percent, and those with balanced books of business saw premium growth of 3.1 percent (Figure 5).
Fig. 5
Underwriting performance
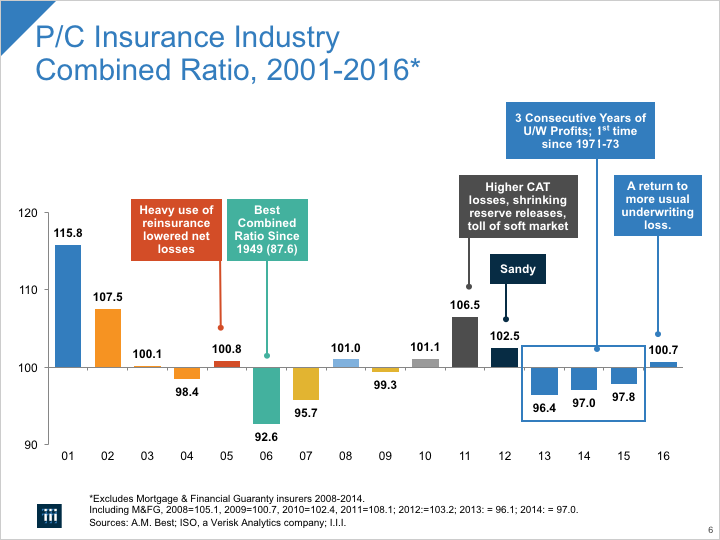
The industry’s overall underwriting loss was $2.4 billion. This is the difference between earned premiums on the one hand, and the sum of incurred losses, expenses and dividends to policyholders on the other. Another widely used industry metric for gauging overall insurance operations (excluding investment performance) is the combined ratio. The combined ratio is the sum of three percentages: losses and loss adjustment expenses as a percent of earned premiums; policyholder dividends as a percent of earned premiums; and other expenses as a percent of written premiums. In 2016 this ratio was 100.7, which means that, considering all lines of business together, insurers paid out slightly more than they took in as premiums for insurance they provided. As Figure 6 shows, this is a departure from the previous three years which, thanks to a slightly lower toll of CAT claims, generated combined ratios under 100. For the longer term, over the last 16 years, the industry has produced seven years of underwriting profits and another five years that were close to break-even, including 2016.
Fig. 6
Some of the blame for negative underwriting performance in 2016 can be attributed to what have come to be thought of as “moderate” catastrophe losses (as compared to years like 2011 and 2012). Back in the 1990s, in most years CATs produced claims in the $5 billion to $12 billion range (in 2016 dollars). To have $15 billion in catastrophe claims was unusually high. In the last 16 years CAT losses reached or exceeded $30 billion six times (including 2011 and 2012) and were in the range of $15 billion to $23 billion another five times. In 2016, total U.S. CAT claims were estimated to be $23.3 billion, compared to $16.7 billion in 2015.
Non-CAT claims also rose at a faster rate than premiums: They were up by 6.4 percent, from $333.6 billion in 2015 to $355.0 billion in 2016.
Claims reserve releases
Each year insurers reassess the adequacy of their reserves for future claim obligations on current and prior policies. When it is determined that these reserves are higher than needed to cover these obligations, reserves are released. This is called favorable development; in 2016 it totaled $3.8 billion, a notable decrease from the $8.0 billion in reserve releases in 2015, according to ISO/PCI. By lowering estimates for incurred claims, reserve releases improve underwriting results and, all other things equal, bolster profits. Accordingly, a smaller reserve release in 2016 than in 2015 contributed to a smaller profit result in 2016.
Investment performance: Interest rates remain low
For the full year 2016, net investment gains at $53.7 billion were lower (by $2.9 billion) than the $56.6 billion in gains in 2015. In measuring insurance company net investment gains, accounting rules recognize two components: (i) net investment income, and (ii) realized capital gains or losses. Unrealized capital gains or losses are not considered income and affect only surplus on the balance sheet.
Net investment income in 2016
Net investment income itself has basically two elements: interest payments from bonds; and dividends from stock. The industry’s net investment income for the full year 2016 was $46.3 billion, compared to $47.2 billion in 2015 (-1.9 percent). Most of this income comes from the industry’s bond investments, which are mainly high quality corporates and municipals.
The environment for bond investing in 2016 was challenging. Average monthly corporate bond market yields in 2016, as captured by Moody’s AAA-rated seasoned bond index, dropped fairly steadily from 4.0 percent in January 2014 to near 3.3 percent in July, then rose fairly steadily to 4.0 percent in December. For perspective, yields in 2015 were near 3.5 percent for the first four months and near 4.0 percent for the rest of the year.
The U.S. economy still faces some of the same forces that have held interest rates down for the past few years: unused capacity (in both capital resources and labor); cautious consumer and business spending; and low near-term future expectations for inflation and for the economy. Further, although the Federal Reserve Open Market Committee has begun raising short-term rates, this has not, so far, lifted longer-term interest rates as many had expected.
The other significant source of net investment income (apart from bond yields) is stock dividends. In 2016 market-wide net dividends from all common and preferred stock grew fairly steadily from $963.3 billion in the first quarter to $982.0 billion in the fourth quarter. For the industry on average stock holdings constitute roughly only about one-sixth of the industry’s invested assets.
Realized capital gains
Realized capital gains in 2016 were $7.3 billion, compared to $9.4 billion in 2015. The broad stock market’s total return was 6.1 percent in 2016, providing few opportunities for capital gains. Again, however, the industry’s overall stock allocation represents only about one-sixth of invested assets.
Policyholders’ surplus (capital or capacity)
Policyholders’ surplus as of December 31, 2016 stood at $700.9 billion, up $26.8 billion from year-end 2015. This is the highest dollar measure of policyholder surplus. The industry is, and will remain, extremely well capitalized and financially prepared to pay very large scale losses in 2017 and beyond. One commonly used measure of capital adequacy, the ratio of net premiums written to surplus, currently stands at 0.75, close to its strongest level in modern history.
Summary
The property/casualty insurance industry turned in a modest performance in 2016 in terms of underwriting performance and overall return on average surplus (profitability). In addition, policyholders’ surplus set an all-time record high. Premium growth, while still modest, is now experiencing its longest sustained period of gains in a decade.
Fundamentally, the P/C insurance industry remains quite strong financially, with capital adequacy ratios remaining high relative to long-term historical averages.
A detailed industry income statement for 2016 follows.
To view the full report from ISO and PCI, click
here.
FULL-YEAR 2016 FINANCIAL RESULTS*
| |
$ Billions |
Percent change from 2015 |
| Net Earned Premiums |
$523.5 |
3.5% |
| Incurred Losses (Including loss adjustment expenses) |
378.3 |
8.0% |
| Expenses |
140.5 |
-14.7% |
| Policyholder Dividends |
2.3 |
-8.5% |
| Net Underwriting Gain (Loss) |
-4.7 |
-153.1% |
| Investment Income |
46.3 |
-1.9% |
| Other Items |
1.0 |
-29.9% |
| Pre-Tax Operating Income |
42.6 |
-26.1% |
| Realized Capital Gains (Losses) |
7.3 |
-22.0% |
| Pre-Tax Income |
49.9 |
-25.5% |
| Taxes |
7.3 |
-28.3% |
| Net After-Tax Income |
$42.6 |
-25.0% |
| Surplus (End of Period) |
$700.9 |
4.0% |
| Combined Ratio |
100.7 |
-3.0% |
|
*Figures may not add to totals due to rounding. Calculations in text based on unrounded figures.