MEMBERSHIP
AMPLIFY
EN ESPAÑOL
Connect With Us
- Popular search terms
- Automobile
- Home + Renters
- Claims
- Fraud
- Hurricane
- Popular Topics
- Automobile
- Home + Renters
- The Basics
- Disaster + Preparation
- Life Insurance

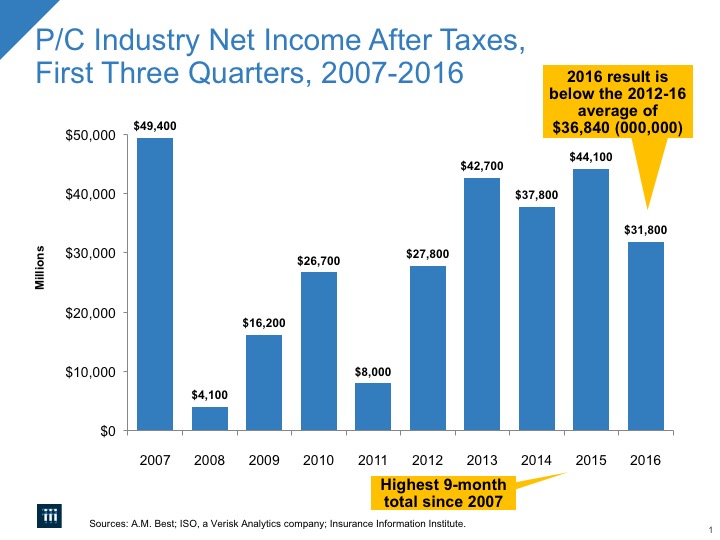
The property/casualty industry’s financial results for the first three quarters of 2016 were by most measures less successful when compared to the comparable period for 2015.
The property/casualty industry’s financial results for the first three quarters of 2016 were by most measures less successful when compared to the comparable period for 2015. Net written and net earned premiums grew, but more slowly; underwriting losses this year followed underwriting gains last year; and net investment gains were smaller this year than last, leading to profits of $31.8 billion vs. $44.1 billion for last year’s first three quarters (Figure 1). Although these data do not include the fourth quarter of 2016, the final quarter is unlikely to brighten the picture, with claims from Hurricane Matthew and the typical fourth-quarter slowdown in premium growth yet to come.
Fig. 1
But put into context, the results of the first three quarters of 2016 can be understood as a “reversion to the mean,” in which the 2015 results can be seen as more outlier than trend, and the lower 2016 results as more in keeping with those from more “normal” recent years. Specifically, the $44.1 billion property/casualty (P/C) insurance industry overall net income after taxes (profits) in the first nine months of 2015 was the highest nine-month total since 2007. In contrast, in recent years profits in the first nine months were $27.8 billion in 2012, $42.7 billion in 2013 and $37.8 billion in 2014.
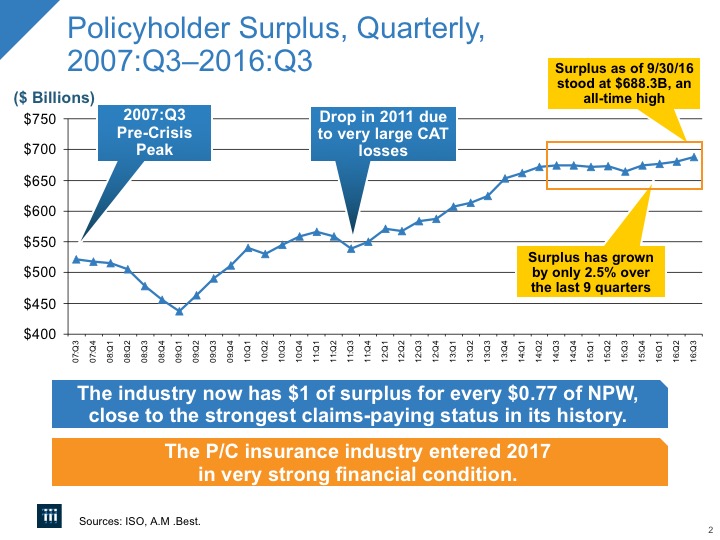
One bright note: at the end of the first three quarters of 2016, overall industry capacity (as measured by policyholders’ surplus—what in other industries would be called net worth) reached an all-time high of $688.3 billion, driven largely by unrealized capital gains (Figure 2).
Fig. 2
The industry results were released by ISO, a Verisk Analytics company, and the Property Casualty Insurers Association of America (PCI).
The industry’s insurance performance in the first three quarters of 2016 roughly broke even. A discussion of the key drivers of the nine-month performance follows.
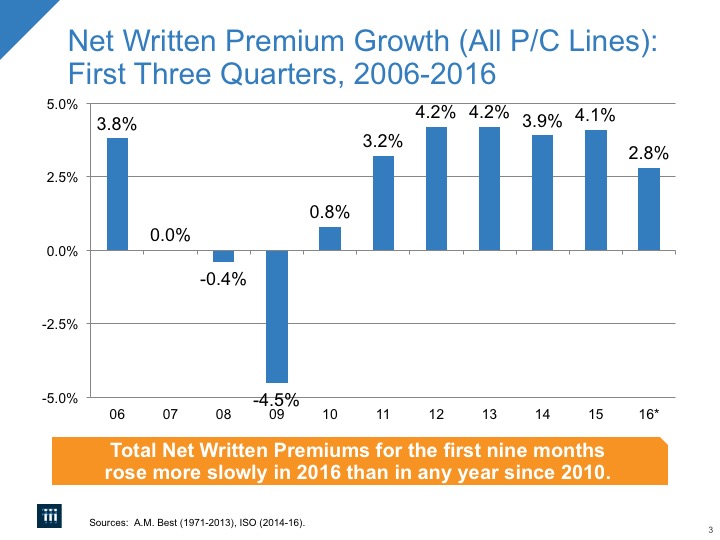
Net written premiums in the first three quarters of 2016 grew by 2.8 percent; in the comparable period in 2015 they grew by 4.1 percent (Figure 3). Although weaker than a year earlier, 2.8 percent growth is still about a percentage point faster growth than the overall rate of inflation.
Fig. 3
There are two main drivers of premium growth in the property/casualty insurance industry: exposure growth and rate activity. Exposure growth—basically an increase in the number and/or value of insurable interests (such as property and liability risks)—is driven mainly by economic and demographic growth and development. Overall economic growth in 2016 has been weak: real (inflation-adjusted) GDP rose at an anemic annual rate of 0.8 percent in the first quarter of 2016 and 1.4 percent in the second quarter, although real GDP expanded at a robust 3.5 percent annual clip in the third quarter. The big question now is whether growth will continue at a 3+ percent annual pace or return to the 2 percent pace that has been more typical of the post Great Recession period. There are sound economic reasons supporting each of these outlooks.
As is often the case, in 2016 some sectors did better than others. For example, 2016 is on pace to be the second year in a row of a near-record number of new cars purchased. And even if old cars are being replaced only one-for-one, the new cars represent higher value and possibly additional coverage (since they likely include comprehensive and collision, whereas older cars tend not to have these coverages).
Exposure growth in other key areas of the economy included continued residential and commercial construction, and consistent employment and payroll growth.
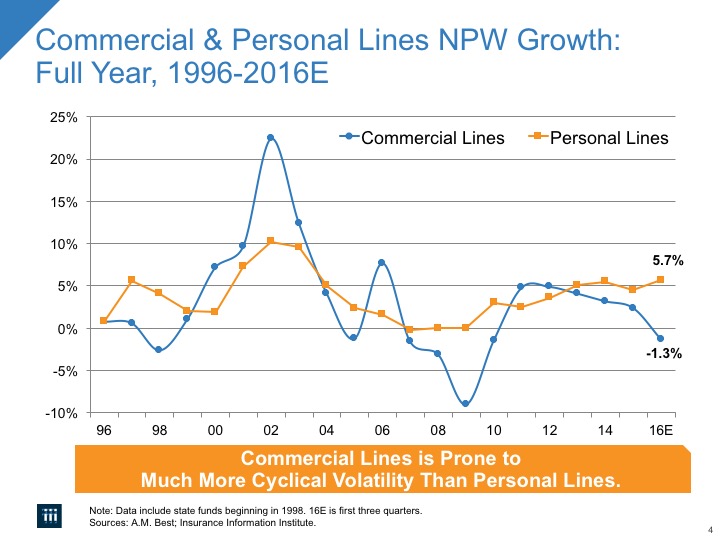
Premium growth differed significantly by line of business (Figure 4). Insurers writing mainly personal lines saw net written premiums rise by 5.7 percent over the comparable period in 2015 (vs. a rise of 5.5 percent for the comparable period in 2015 over the first nine months of 2014); insurers writing mainly commercial lines, excluding mortgage and financial guaranty insurers, saw net written premiums fall by 1.3 percent (vs. a rise of 2.4 percent for the comparable period in 2015); and insurers writing generally balanced books of business saw net written premiums rise by 3.7 percent (vs. 4.9 percent in the comparable period in 2015).
Fig. 4
Continuing growth in the number of people employed throughout the U.S. economy in 2016 also affected top line growth in the P/C insurance industry. Job growth benefits the entire economy, of course, but the expansion of payrolls affects workers compensation premiums in particular. The United States economy added 2.5 million nonfarm jobs from the fourth quarter of 2015 through the third quarter of 2016—the third straight such four-quarter period of job growth at least this strong. Combined with slightly above inflation increases in pay (as has been the case for the past few years), payrolls are expected to continue growing, resulting in billions of dollars in new premiums written by workers compensation insurers in 2017.
The other important determinant in industry premium growth is rate activity. Rates tend to be driven by trends in claims costs; conditions in the reinsurance market; underwriting, marketing and distribution costs; and investments in technology, among other factors. Claims costs, in particular, rose sharply in the first three quarters of 2016.
Incurred losses and loss-adjustment expenses grew by 7.6 percent in the first three quarters of 2016 vs. a rise of 2.7 percent in the comparable period in 2015. The industry experienced sharp increases in both catastrophe-related claims and non-catastrophe claims. CAT claims spiked by $4.8 billion (from $14.0 billion to $18.8 billion, up 34.3 percent). Catastrophe claims are already at their highest level since 2012—the year of Superstorm Sandy—and the claims from Hurricane Matthew and other Q4 events will push that total higher.
Non-CAT claims rose sharply, by $14.9 billion (from $246.2 billion to $261.1 billion, up 6.1 percent). These numbers are net of reinsurance recoveries and reserve releases (see below) and include loss-adjustment expenses.
The trend in insured losses for private passenger and commercial auto is for both increased severity (a long-term trend) and increased frequency (a last-two-years trend), as discussed in the I.I.I. white paper Personal Automobile Insurance: More Accidents, Larger Claims Drive Costs Higher (available on www.iii.org). More auto crashes result from a number of coincident forces, including more drivers on the road, particularly at rush hour (with 8 million more people employed in the last three years), bad weather (both harsh winters and floods) and distracted driving.
Underwriting expenses grew by 2.6 percent, basically tracking net written premium growth. Although it is not as easy to measure productivity in P/C insurance as it is in, say, manufacturing, it is noteworthy that property-casualty insurers employed only 8,500 more people (not seasonally adjusted) in the first nine months of 2016—an increase of only 1.6 percent over the number employed at the end of the third quarter of 2015.
Reserve releases are generally associated with new estimates of expected costs for claims occurring in past accident years. Overall inflation continues to be remarkably low, likely contributing to these lower estimates, although prices for some items that comprise claims payouts have been increasing at higher rates than general measures of inflation (see the I.I.I.’s Inflation Watch spreadsheet). For the first three quarters of 2016, the industry reported releases of prior-year claims reserves totaling $6.5 billion, down from $9.3 billion of reserve releases in the first three quarters of the previous year. Released reserves go directly to the industry’s “bottom line.”
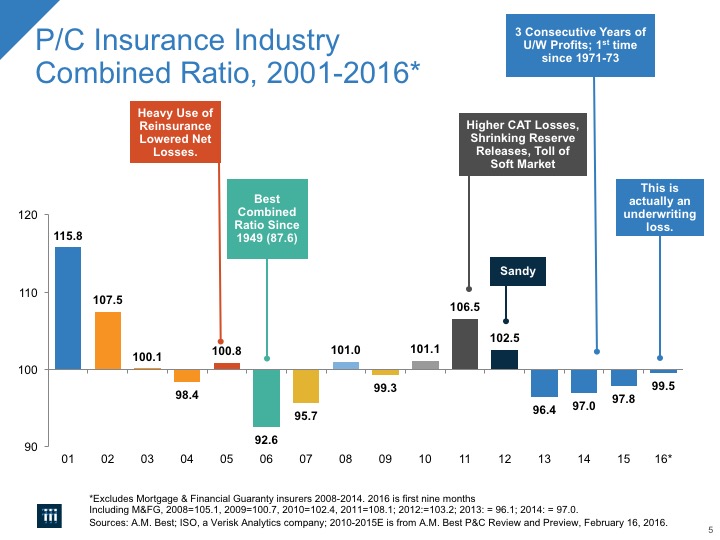
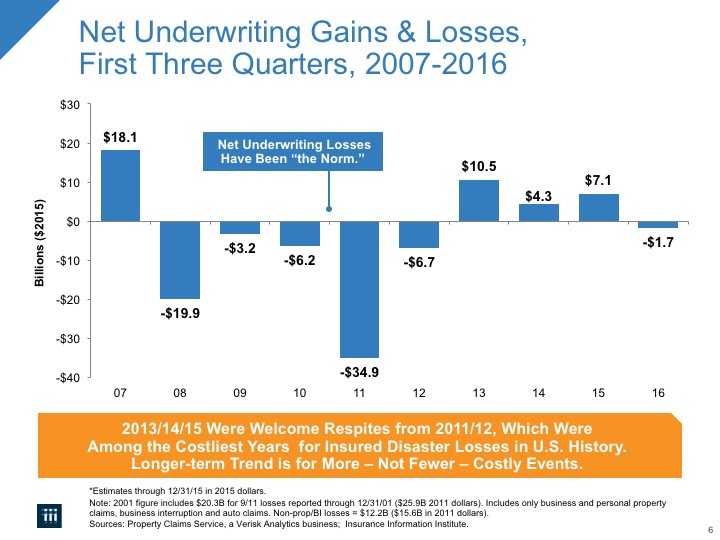
The industry’s overall underwriting loss was $1.7 billion; another measure of overall underwriting performance, the combined ratio, was 99.5 for the first three quarters of 2016. Normally, a combined ratio under 100 signals an underwriting gain—but not this time (Figure 5). The combined ratio is the sum of three percentages: losses and loss adjustment expenses, and policyholder dividends, as percents of earned premiums, and other expenses as a percent of written premiums. Because the three elements use different bases (earned vs. written premiums), $1.7 billion of outgoing over premium income implies, in the combined ratio calculation, that the industry posted an underwriting profit in the first nine months of 2016—it didn’t (Figure 6).
Fig. 5
Fig. 6
The underwriting loss for the first three quarters of 2016 is based, in part, on a small underwriting loss in the third quarter by itself ($0.2 billion). This breaks another pattern. From a longer-term historical perspective, quarterly underwriting losses have been the norm over the past several decades—especially the second calendar quarter. However, since the start of 2013, the industry has posted a quarterly underwriting profit in every single quarter except the second quarter. That represents three unprofitable quarters (second quarter 2013, second quarter 2014 and second quarter 2015) and eight profitable quarters (first quarter 2013, third quarter 2013, fourth quarter 2013, first quarter 2014, third quarter 2014, fourth quarter 2014, first quarter 2015 and third quarter 2015) out of the last 11. The underwriting loss in 2016:Q3 is the first loss in a third calendar quarter since third quarter 2012.
These days, with investment income below levels that would be produced if interest rates were at higher levels, P/C companies generally need to maintain combined ratios below 95 in order to earn their cost of capital in a still challenging interest rate environment.
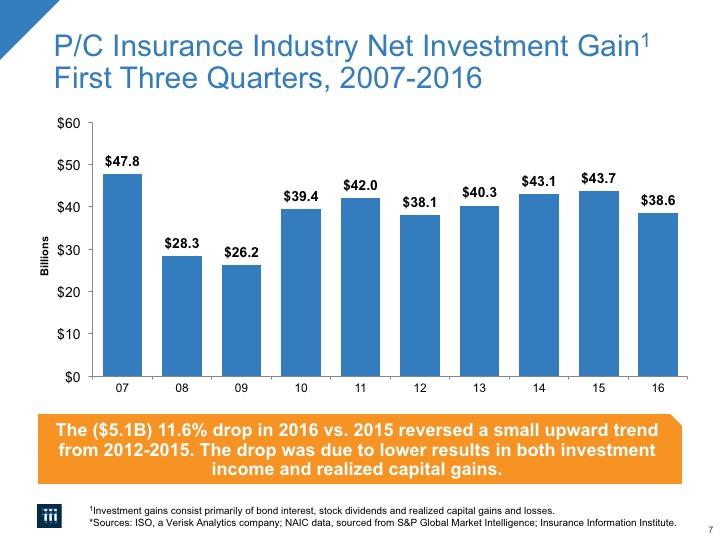
For the first three quarters of 2016, net investment gains (which include net investment income plus realized capital gains and losses) dropped sharply vs. the year-earlier period—they fell by $5.1 billion (down 11.6 percent) to $38.6 billion, compared to $43.7 billion in the first three quarters of 2015. Keep this drop in perspective: 2015 saw the highest total net investment gains since 2007 ($47.8 billion), and the second-highest since the start of ISO’s records in 1986 (Figure 7).
Fig. 7
Net investment income has basically two elements: interest payments from bonds and dividends from stock. The industry’s net investment income for the first three quarters of 2016 was $33.0 billion, down by 5.2 percent from $34.9 billion in the first three quarters of 2015. According to ISO/PCI, this is the lowest nine-months investment income since 2004. Most of this income comes from the industry’s bond investments, which are mainly high quality corporates and municipals.
Corporate bond market yields, as captured by Moody’s AAA-rated seasoned bond index, in 2016:Q1 averaged 3.9 percent, dropped to 3.6 percent in April and May then sank again, averaging 3.4 percent from June through September. And although the Federal Reserve Board raised short-term interest rates in December 2016 and says it expects to raise them further two or three times in 2017, most forecasters do not expect this to have much effect on long-term rates in 2017. (The December 2015 increase had virtually no effect on long-term rates.) On the other hand, the yield on the bellwether 10-year U.S. Treasury bond rose from 1.37 percent on July 8 to 1.70 percent in mid-September, possibly anticipating a Fed increase in September that did not materialize. The 10-year U.S. Treasury bond yield rose further, to 1.83 percent on November 7 (the day before Election Day), perhaps anticipating an even more likely Fed increase in December. From Election Day to December 15, it spiked up to 2.60 percent. We do not know why this spike occurred, but some attribute it to anticipation of tax cuts and other stimulus following Donald Trump’s election. The Fed raised short-term rates by one-quarter of a percentage point on December 16.
We focus on long-term interest rate levels because higher rates can have two effects on the financial status of property/casualty insurance companies—both positive. In general, higher yields mean greater investment income and a higher discount rate applied to “long-tail” reserves, which results in lowering reserves for future claim payments, thus supporting reserve releases.
Nevertheless, it might be a few years before rate increases take full effect. Whatever level prevailing long-term rates attain in 2017, funds from maturing bonds will likely be reinvested at rates that might be lower than, or at best only slightly higher than, the yields of prior investments.
The other significant source of net investment income (besides bond yields) is stock dividends, which were essentially flat during the first three quarters of 2016. Stock holdings in general represent roughly only about one-sixth of the industry’s invested assets.
Only realized capital gains and losses affect insurer net income; unrealized capital gains and losses affect policyholders’ surplus. Realized capital gains from the first three quarters of 2016 were $5.6 billion, down from $8.8 billion through the first three-quarters of 2015.
The broad stock market performed dismally in the first month of 2016, then rose fairly steadily so that by the end of the first three quarters it had risen 6.7 percent. The near-term outlook for inflation remained below the Fed’s expectations and desires, driven by the plummeting price of oil. As the third quarter ended, most forecasters were lowering their predictions for global growth rates.
Driven in part by unrealized capital gains, policyholders’ surplus as of September 30, 2016, stood at $688.3 billion—its highest-ever level. Policyholders’ surplus has generally increased in recent years as industry profits rose and as assets in the industry’s investment portfolio increased in value in the wake of the recovery from the financial crisis and Great Recession.
One commonly used measure of capital adequacy, the ratio of 12-month trailing net premiums written to surplus, currently stands at 0.77, close to its strongest level in modern history. (A ratio of 1.0 is considered strong, and a lower ratio is even stronger.) The bottom line is that the industry is, and will remain, extremely well capitalized and financially prepared to pay very large scale losses in 2016 and beyond.
The combined effect of lower profits and a larger capital base than a year ago produced an overall 6.2 percent rate of return on average surplus (profitability) in the first three quarters of 2016, down from 8.8 percent in the first three quarters of 2015.
The property/casualty insurance industry turned in a profitable performance in the first three quarters of 2015. Policyholders’ surplus hit an all-time record high. Despite rising CAT and non-cat losses, and persistently low interest rates, premium growth, while still modest, is now experiencing its longest sustained period of gains in a decade. Fundamentally, the P/C insurance industry remains quite strong financially, with capital adequacy ratios remaining high relative to long-term historical averages.
A detailed industry income statement for the first three quarters of 2016 follows.
To view the full report from ISO and PCI, click here.