Spotlight on: Flood insurance

Overview

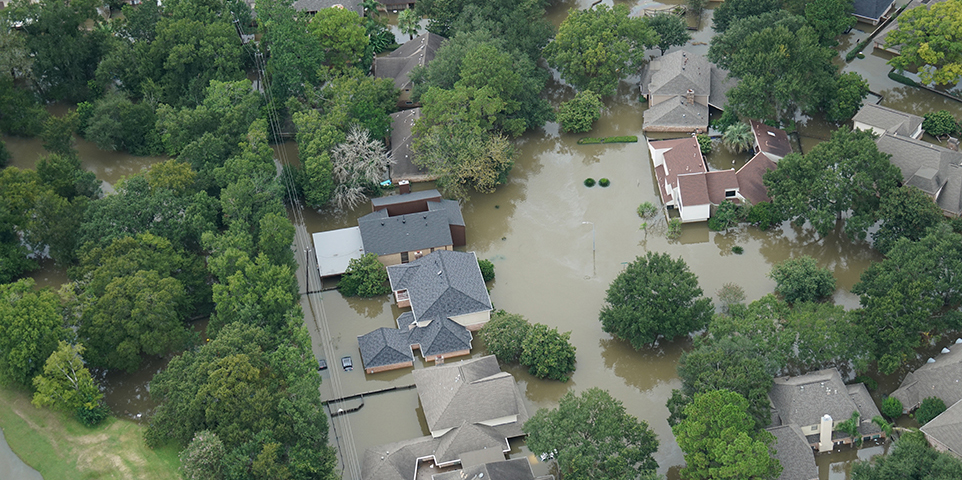
Flooding is the most common and costly natural disaster in the United States, causing billions in economic losses each year. According to the National Flood Insurance Program (NFIP), 90 percent of all natural disasters in the United States involve flooding.

There is no coverage for flooding in standard homeowners or renters policies or in most commercial property insurance policies. Coverage is available in a separate policy from the National Flood Insurance Program (NFIP) and from many private insurers.

Recent developments

  • On April 1, 2021, the Federal Emergency Management Agency (FEMA) announced it will implement a new rating methodology designed to provide actuarially sound rates that are equitable and easy to understand. According to FEMA more than 200,000 policies will have significant increases in premiums, while about 1.15 million will have decreases.
  • The new rates went into effect on October 1, 2021 for new policies and will go into effect on all remaining policies renewing on or after April 1, 2022. A Triple-I Blog post explains how the new rating methodology will make the system fairer.
  • In 2019, federal regulators announced a rule requiring regulated lending institutions to accept private flood insurance policies comparable to the National Flood Insurance Program. The rule took effect July 1, 2019. (See Private flood insurance below.) In June 2014 Florida enacted a law that encourages private companies to offer flood insurance.
  • Hurricane Harvey made landfall in Texas as a Category 4 storm on August 25, 2017 and then turned into the single biggest rain event in U.S. history. Harvey’s floodwaters have caused multiple deaths and billions of dollars in property damage in Texas. Harvey made a second landfall in Louisiana on August 30th. It caused $32 billion in insured losses in 2020 dollars, including payouts from FEMA’s National Flood Insurance Program (NFIP), according to Aon.
  • Private flood insurance: Flood insurance had long been considered an untouchable risk by private insurers because they did not have a reliable way of measuring flood risk. In recent years insurers have become increasingly comfortable with using sophisticated models to underwrite insurance risk, and modeling firms are getting better at predicting flood risk, resulting in more companies covering the risk. Private carriers can also offer higher coverage than FEMA’s NFIP policies, currently capped at $250,000 for residential buildings and $500,000 for non-residential buildings. In 2020, 58 private companies were writing flood insurance, compared with 41 in 2019, according to S&P Global Market Intelligence.
  • NFIP Reinsurance: The NFIP has created public funding programs to narrow its deficit. Since 2016, it has been using reinsurance protection. For 2021, NFIP arranged for $1.15 billion in coverage from 32 private reinsurers, up from 27 in 2020. The cost of reinsurance coverage for 2021 was $195.8 million, compared with $205 million in 2020 for $1.33 billion of coverage. In terms of total coverage and the structure of the coverage, FEMA would have slightly less reinsurance in 2021, according to Artemis.
  • NFIP Catastrophe bonds: In August 2018, FEMA launched its first catastrophe bond to transfer risk from NFIP to the capital markets, as reported by Artemis. It was the first catastrophe bond to solely provide reinsurance coverage for flood risks. In February 2021, $575 million was secured for flood reinsurance protection from a fourth FloodSmart Re catastrophe bond. According to Artemis, the 2021 cat bond raises FEMA’s NFIP flood reinsurance program funds to $2.925 billion of reinsurance protection, which will be reduced to $2.425 billion as the 2018 bond matures.
  • NFIP policies, premiums and payments: The number of policies in force has been declining from the high point of 5.7 million in 2009 to 4.95 million by August 2021. NFIP earned premiums rose 0.6 percent in 2018 after falling 0.7 percent in 2017. Flood loss payments totaled $1.4 billion in 2018, well below the $8.7 billion paid in 2017. Flood loss payments totaled $9.5 billion in 2012, the year of superstorm Sandy. In 2005 loss payments totaled $17.8 billion, the highest amount on record, including losses from Hurricanes Katrina, Rita and Wilma.
  • In 2020, direct premiums written for private flood insurance increased to $302.4 million, up 5.3 percent from $287.2 million in 2019, but below premiums in 2018, when they reached $540.9 million, according to S&P Global Market Intelligence. Premiums in 2019 were impacted by the largest writer of private flood insurance, FM Global, reclassifying private flood insurance into allied lines. When 2018 net premiums written are restated to exclude premiums from FM Global, they total $307.9 million. Restated net premiums written for 2020 are $302.4 million, and are approximately at the same level as they were in 2018.
  • Low flood insurance take-up rates: Triple-I surveys conducted prior to 2020 found that 12 to 14 percent of American homeowners said they had a flood insurance policy. In 2020, 27 percent of all American homeowners policyholders said they had flood insurance, a higher rate than estimates cited by the NFIP and other observers. On average, nationwide only 30 percent of homes in the highest-risk areas have flood coverage, according to the Risk Management and Decision Processes Center of the Wharton School at the University of Pennsylvania.

National Flood Insurance Reform

NFIP risk rating reform: On April 1, 2021, FEMA announced it will implement a new rating methodology designed to provide actuarially sound rates that are equitable and easy to understand. According to FEMA more than 200,000 policies will have a significant increase in premiums, while about 1.15 million policies will have a decrease. The new rates went into effect on October 1, 2021 for new policies and will go into effect on all remaining policies renewing on or after April 1, 2022. A Triple-I Blog post explains how the new rating methodology will make the system fairer.

In 2012, the Biggert-Waters Flood Insurance Reform Act was passed in an attempt to make the federal flood insurance program more financially self-sufficient by eliminating rate subsidies that many property owners in high-risk areas receive. But in March 2014, Congress rescinded many of the rate increases called for by the act. The new law reduced some rate increases already implemented, prevented some future increases, and put a surcharge on all policyholders. The measure also authorized funds for the National Academy of Sciences to complete an affordability study.

The 2014 law prevented any policyholder from seeing an annual rate increase exceeding 18 percent. It called on the flood program’s administrator, FEMA, to “strive” to prevent coverage from costing more than 1 percent of the amount covered. In other words, if the policy offered $100,000 of coverage, the premium would not exceed $1,000. The 18 percent cap will result in refunds in some cases. Refunds began in October 2014.

The law also reinstates a practice known as grandfathering, meaning properties re-categorized as being at a higher risk of flooding under FEMA’s revised maps would not be subject to large increases.

It also ends a provision in Biggert-Waters that removed a subsidy once a home was sold. People who purchased homes after Biggert-Waters became law will receive a refund. Many lawmakers in coastal states were concerned that the higher cost of flood insurance would hurt the real estate industry. The subsidy will now be covered by a $25 surcharge on homeowners’ flood policies and a $250 surcharge on insurance for nonresidential properties and vacation homes.

According to FEMA, most current flood insurance policyholders at that time (81 percent, or 4.5 million) paid rates based on the true risk of flood damage and so were not affected by Biggert-Waters or the subsequent rollback. Properties most affected by the rate hikes were in high-risk flood zones; were built before communities adopted their first flood insurance rate map; were second homes; or are second homes that have not been elevated. Others affected include businesses and people living in homes that have been repeatedly flooded.

Private Flood Insurance

According to NAIC data compiled by S&P Global Market Intelligence, in 2020 net premiums written for private flood insurance totaled $302.4 million, up 5.3 percent from $287.2 million in 2019 but below premiums in 2018, when they reached $540.9 million. Premiums in 2019 were impacted by the largest writer of private flood insurance, FM Global, reclassifying private flood insurance into allied lines. When 2018 net premiums written are restated to exclude premiums from FM Global, they total $307.9 million. Restated net premiums written for 2020 are $302.4 million and are approximately at the same level as they were in 2018. Direct premiums written (premiums before reinsurance transactions) for private flood insurance totaled $735.1 million in 2020, up 40 percent from $522.6 million in 2019. In 2020, 58 private companies were writing flood insurance, compared with 41 in 2019.

Flood Resilience

Disaster resilience refers to the ability of communities to prepare for, recover from, and adapt to adverse events.

Some of the best practices for community flood resilience recommended by the Environmental Protection Agency include: a comprehensive disaster recovery plan; green infrastructure techniques; land conservation in river corridors; restoring wetland vegetation; discouraging development in frequent flood areas; adapting flood resistant building codes; and coordinating with neighboring jurisdictions to implement a watershed-wide approach to storm-water management.

Urban planners and engineers around the world are developing innovative flood solutions such as amphibious housing, porous roads and sidewalks, and use of satellite data for more frequent flood alarms.

A 2017 National Institute of Building Sciences study found that for every dollar invested in riverine flood mitigation the return was $7 in cost savings.

Flood coverage in other countries

The system in the United States is unique in that for the most part the government underwrites the coverage and private insurers act as administrators bearing no actual flood risk.

In other developed countries, there are two basic methods of providing flood insurance. Under the first, the optional system, insurers extend their standard policy to include supplemental coverage for flood damage on payment of additional premium. The coverage tends to be expensive because only those most likely to be flooded, and therefore to file claims, purchase it, a situation known in the insurance industry as adverse selection. Among the countries with optional coverage are Germany and Italy.

The other method is “bundling.” Under this system, flood coverage is combined with coverage for other perils such as fire and windstorm, thus spreading the risk of flood losses across a large geographical area and greatly increasing the percentage of the population covered for flood damage. Countries that have adopted this method include the United Kingdom, Spain and Japan. In addition, in some countries such as France and Spain there are government compensation programs for major disasters, including flooding, that take effect when the cost of a disaster reaches a certain level.

In 2014 the United Kingdom launched Flood Re, a not-for-profit reinsurance organization to take on flood risks that primary insurers do not want. If an insurer calculates that the flood risk of a particular policy exceeds the flood premium, it will cede that risk to Flood Re. The insurer will pay the claim, then seek reimbursement from Flood Re. In all likelihood, Flood Re’s losses and expenses will exceed its premium. Additional funding will come from a levy raised from insurers by market share.

Charts and graphs

Top 10 Most Significant Flood Events By National Flood Insurance Program Payouts (1)


Rank Date Event Number of
paid losses
Amount paid
($ millions)
when occurred
Amount paid
($ millions)
in 2023 dollars
Average paid loss
in 2023 dollars
1 Aug. 2005 Hurricane Katrina 168,200 $16,330 $25,592 $152,152
2 Oct. 2012 Superstorm Sandy 132,800 8,967 11,931 89,842
3 Sep. 2017 Hurricane Harvey 77,100 9,015 11,302 146,589
4 Sep. 2022 Hurricane Ian 48,000 4,300 4,441 92,521
5 Sep. 2008 Hurricane Ike 46,900 2,711 3,814 81,322
6 Aug. 2016 Louisiana severe storms and flooding 27,600 2,522 3,223 116,775
7 Sep. 2004 Hurricane Ivan 31,000 1,671 2,709 87,387
8 May 2001 Tropical Storm Allison 62,200 1,110 1,919 30,852
9 Aug. 2011 Hurricane Irene 43,800 1,344 1,826 41,689
10 Apr. 2017 Hurricane Irma 22,300 1,094 1,365 61,211

(1) Includes events from 1978 to December 31, 2023 as of January 2024. Defined by the National Flood Insurance Program as an event that produces at least 1,500 paid losses. Ranked on Amount Paid in 2023 dollars.

Source: Federal Emergency Management Agency (FEMA) National Flood Insurance Program (NFIP) data; analysis courtesy of Aon.

View Archived Tables

Private Flood Insurance, 2017-2022

($000)

Year Net premiums
written (1)
Annual percent
change
Combined
ratio (2)
Annual point
change (3)
2017 $470,961.0 0.7% 186.1 92.3 pts.
2018 540,875.0 0.1 55.0 -131.1
2019 287,197.0 -46.9 58.5 3.5
2020 302,444.0 5.3 50.7 -7.8
2021 524,209.0 73.3 65.0 14.3
2022 768,688.0 46.6 70.8 5.8

(1) After reinsurance transactions, excludes state funds and premiums written by private insurers participating in the National Flood
Insurance Program's Write Your Own program.
(2) After dividends to policyholders. A drop in the combined ratio represents an improvement; an increase represents a deterioration.
(3) Calculated from unrounded numbers.

Source: NAIC data, sourced from S&P Global Market Intelligence, Insurance Information Institute.

View Archived Tables

Top 10 Writers Of Private Flood Insurance By Direct Premiums Written, 2022 (1)

($000)

Rank Group/company Direct premiums written (2) Market share (3)
1 American International Group (AIG) $173,244 14.0%
2 Zurich Insurance Group 147,805 11.9
3 Assurant Inc. 120,520 9.71
4 AXA 117,210 9.4
5 Berkshire Hathaway Inc. 101,830 8.2
6 Swiss Re Ltd. 72,549 5.9
7 Sompo 71,000 5.7
8 Liberty Mutual 70,910 5.7
9 Chubb 48,238 3.9
10 Allstate Corp. 44,280 3.6

(1) Private flood includes both commercial and private residential coverage, primarily first-dollar standalone policies that cover the flood peril and excess flood. Excludes sewer/water backup and the crop flood peril.
(2) Before reinsurance transactions.
(3) Based on U.S. total, includes territories.

Source: NAIC data, sourced from S&P Global Market Intelligence, Insurance Information Institute.

View Archived Tables

Additional resources

Flood Insurance Data and Analytics, National Flood Insurance Program, FEMA


© Insurance Information Institute, Inc. - ALL RIGHTS RESERVED

Back to top

Catastrophes | Homeowners
Facts + Statistics: Flood insurance
Catastrophes
Facts + Statistics: Hurricanes
Catastrophes
Background on: Hurricane and windstorm deductibles