Background on: Motorcycle crashes

Overview

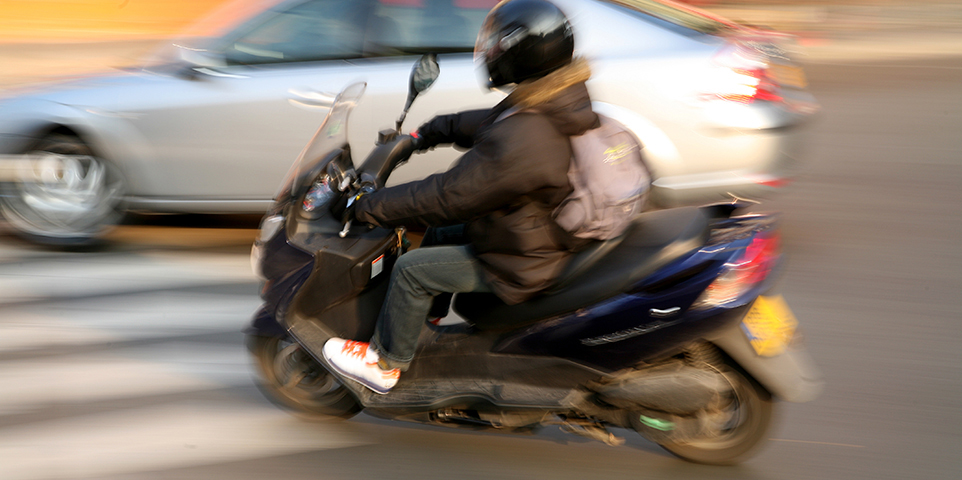
Motorcyclists are more vulnerable on the road and are more likely to be injured or killed than car occupants, with a 2019 data comparison showing 29 times more fatalities. Data from that year also indicates that older riders appear to sustain more serious injuries than younger riders, as riders over 50 account for 37 percent of all deaths.

Motorcycle crashes cost billions of dollars per year in direct expenses, such as: 

  • local emergency services;
  • medical and rehabilitation fees;
  • property damage; 
  • loss of market productivity (including lost wages, loss in household productivity); and 
  • insurance costs (including claims and legal fees and expenses).

Driver behavior

  • Alcohol use remains a major factor in motorcycle accidents, as it potentially impacts driver alertness and response.
  • Alcohol impaired motorcycle riders are also less likely to use helmets.
  • Speeding is another major factor in fatal crashes.

Insurance claims

  • A Highway Loss Data Institute report shows that SuperSport motorcycles had the highest relative overall collision losses compared with nine other motorcycle classes.
  • The high overall losses for SuperSport models were driven up by their high claim frequency.

Motorcycle safety tips

  • Take a motorcycle safety course: Motorcycles can be much more dangerous than driving a car, and drivers of any experience or level can benefit from a safety course. Not every state requires these courses, but you should be able to find one in your region. Also, national organizations like the Motorcycle Safety Foundation (MSF) offer guides for riding in groups on the road or alone on the trails, among other topics.
  • Wear a helmet and correct motorcycle gear: Certain states require helmets, which can help guard against serious head injury. Eye protection is also important to protect against debris that may be hit by other vehicles. Proper riding gear, clothing, and boots can safeguard against road rash, while potentially lowering the severity of muscular or skeletal injuries in the case of a crash. Additionally, longer rides may require rain gear.
  • Inspect your bike: Mechanical failures during a ride can cause a serious crash. Pre-ride inspections can confirm that headlamps, turn signals, and brake lights are working correctly. The MSF recommends checking TCLOCS (tires, controls, lights, oil, chassis, stands) to check which areas are most important before getting on your bike.
  • Obey traffic rules: Although it is viewed as common logic, observing traffic rules is particularly significant on a motorcycle because of the heightened exposure a rider has on a bike. As there is a greater chance of severe injury or death in a motorcycle accident, motorcyclists should vigilantly follow the rules of the road. Full stops, slowing down for yellow lights and observing speed limits can help reduce the risk of a serious accident.
  • Stay alert, observant, and visible: Motorcycle collisions often occur because drivers of cars or trucks do not see bikes on the roadway. Motorcyclists must take every preventive measure to ensure they are seen by other drivers. Visible clothing can be used during the day, and reflective materials on bike frames or outerwear can increase visibility at night. Avoid the use of alcohol.Use defensive driving, checking ahead and from side to side for potential risks that could cause a collision. A motorcyclist should presume that other drivers cannot see their bike, staying at safe braking distances and manageable speeds when steering in blind spots or when near cars.

Don’t forget adequate insurance coverage. Visit our page to find out more about finding the right policy for your needs.

Charts and Graphs

Motorcycle Helmet Use, 2000-2022 (1)


Year Percent Year Percent
2000 71% 2018 71%
2005 48 2019 71
2010 54 2020 69
2015 61 2021 65
2016 65 2022 67
2017 65    

(1) Based on surveys of motorcyclists using helmets meeting Department of Transportation standards. Surveys conducted in October for 1996-2000 and in June thereafter.

Source: U.S. Department of Transportation, National Occupant Protection Use Survey, National Highway Traffic Safety Administration's National Center for Statistics and Analysis.

View Archived Tables

Motorcyclist Fatalities And Fatality Rates, 2012-2021


Year Fatalities Registered
motorcycles
Fatality rate per 100,000
registered motorcycles
Vehicle miles
traveled (millions)
Fatality rate
per 100 million
vehicle miles traveled
2012 4,986 8,454,939 58.97 21,385 23.32
2013 4,692 8,404,687 55.83 20,366 23.04
2014 4,594 8,417,718 54.58 19,970 23.00
2015 5,029 8,600,936 58.47 19,606 25.65
2016 5,337 8,679,380 61.49 20,445 26.10
2017 5,226 8,664,108 60.32 20,149 25.94
2018 5,038 8,659,741 58.18 20,076 25.09
2019 5,044 8,596,314 58.68 19,688 25.62
2020 5,506 8,347,435 65.96 17,947 30.68
2021 5,932 9,881,414 60.03 19,738 30.05

Source: U.S. Department of Transportation, National Highway Traffic Safety Administration; Federal Highway Administration.

View Archived Tables

Motorcyclist Injuries And Injury Rates, 2012-2021


Year Injuries Registered
motorcycles
Injury rate per 100,000
registered motorcycles
Vehicle miles
traveled (millions)
Injury rate
per 100 million
vehicle miles traveled
2012 93,251 8,454,939 1,103 21,385 436
2013 88,760 8,404,687 1,056 20,366 436
2014 91,987 8,417,718 1,093 19,970 461
2015 88,738 8,600,936 1,032 19,606 453
2016 (1) 104,442 8,679,380 1,203 20,445 511
2017 88,592 8,664,108 1,023 20,149 440
2018 81,859 8,659,741 945 20,076 408
2019 83,814 8,596,314 975 19,688 426
2020 78,944 8,347,435 946 17,947 440
2021 82,686 9,881,414 837 19,738 419

(1) NHTSA began using police-reported crash data from the Crash Report Sampling System, replacing the National Automotive Sampling System
General Estimates System (GES). NCSA has also changed the methodology of estimating people nonfatally injured in motor vehicle traffic crashes.

Source: U.S. Department of Transportation, National Highway Traffic Safety Administration; Federal Highway Administration.

View Archived Tables

Occupant Fatality Rates By Vehicle Type, 2012 And 2021


Fatality rate Motorcycles Light trucks Passenger cars
2012      
     Per 100,000 registered vehicles 58.97 7.93 9.73
     Per 100 million vehicle miles traveled 23.32 0.73 0.90
2021      
     Per 100,000 registered vehicles 60.03 7.52 12.53
     Per 100 million vehicle miles traveled 30.20 0.76 1.26
Percent change, 2012-2021      
     Per 100,000 registered vehicles 1.8% -5.2% 28.8%
     Per 100 million vehicle miles traveled 29.5% 4.1% 40.0%

Source: U.S. Department of Transportation, National Highway Traffic Safety Administration.

View Archived Tables

Motorcyclists Killed, by Time of Day and Day of Week, 2021


  Day of week
  Weekday Weekend Total
  Number Percent Number Percent Number Percent
Motorcyclists killed            
Midnight to 3 am 176 5.8% 325 11.3% 501 8.4%
3 am to 6 am 111 3.7 116 4.0 227 3.8
6 am to 9 am 239 7.9 76 2.6 315 5.3
9 am to Noon 253 8.3 181 6.3 434 7.3
Noon to 3 pm 460 15.1 427 14.8 887 15.0
3 pm to 6 pm 737 24.3 529 18.3 1,266 21.3
6 pm to 9 pm 628 20.7 692 24.0 1,320 22.3
9 pm to Midnight 422 13.9 522 18.1 944 15.9
Unknown 13 0.4 17 0.6 38 0.6
Total 3,039 100.0% 2,885 100.0% 5,932 (1) 100.0%

(1) Includes motorcyclists killed on unknown day of week.

Source: U.S. Department of Transportation, National Highway Safety Administration.

View Archived Tables

Vehicles Involved In Fatal Crashes By Vehicle Type, 2012 And 2021


Vehicle involved 2012 2021
Passenger cars    
Involved in crashes 18,269 21,118
Rate per 100 million vehicle miles traveled 1.33 1.96
Rate per 100,000 registered vehicles 14.38 19.57
Light trucks (1)    
Involved in crashes 17,350 25,704
Rate per 100 million vehicle miles traveled 1.35 1.51
Rate per 100,000 registered vehicles 14.62 15.11
Motorcycles    
Involved in crashes 5,113 6,082
Rate per 100 million vehicle miles traveled 23.91 30.81
Rate per 100,000 registered vehicles 60.47 61.55

(1) Trucks with 10,000 pounds or less gross vehicle weight. Includes pickups, vans, truck-based station wagons and utility vehicles.

Source: U.S. Department of Transportation (USDOT), National Highway Traffic Safety Administration (NHTSA). Vehicle miles traveled - USDOT, Federal Highway Administration, revised by NHTSA; Registered passenger cars and light trucks - R.L. Polk & Co; Registered motorcycles - USDOT, Federal Highway Administration.

View Archived Tables

Persons Killed In Total And Alcohol-Impaired Crashes By Person Type, 2021


    Alcohol-impaired crash fatalities (1)
Person type Total killed Number Percent of
total killed
Vehicle occupants      
     Driver 21,786 7,668 35%
     Passenger 6,527 2,078 32
     Unknown occupant 45 8 18
     Total 28,358 9,754 34%
Motorcyclists 5,932 2,023 34%
Nonoccupants      
     Pedestrian 7,388 1,383 19
     Pedalcyclist 966 157 16
     Other/unknown 295 67 23
     Total 8,649 1,607 19%
Total 42,939 13,384 31%

(1) Alcohol-impaired driving crashes are crashes that involve at least one driver or a motorcycle operator with a blood alcohol concentration (BAC) of 0.08 grams per deciliter or greater, the legal definition of alcohol-impaired driving.

Source: U.S. Department of Transportation, National Highway Traffic Safety Administration.

View Archived Tables

Drivers In Fatal Crashes By Blood Alcohol Concentration (BAC) And Vehicle Type, 2012-2021 (1)


  Passenger car Light truck Large truck Motorcycles
    Percent   Percent   Percent   Percent
Year Total BAC = 0.01+ BAC = 0.08+ Total BAC = 0.01+ BAC = 0.08+ Total BAC = 0.01+ BAC = 0.08+ Total BAC = 0.01+ BAC = 0.08+
2012 18,171 26% 23% 17,230 25% 21% 3,774 3% 2% 5,108 35% 28%
2013 17,850 27 23 16,810 25 21 3,872 4 2 4,795 35 27
2014 17,802 26 22 17,040 25 22 3,701 3 2 4,703 37 29
2015 19,688 25 21 18,763 24 21 4,019 2 1 5,126 34 26
2016 20,730 24 21 19,951 23 20 4,152 3 2 5,414 32 25
2017 20,895   24   21   19,847  23 20 4,600  4 3 5,316  35 27
2018 20,175 24   21  19,663 22 19 4,786 5 3 5,108 33 25
2019 19,469 24 20 19,704 22 19 4,949 3 2 5,111 36 29
2020 20,742 26 23 20,402 23 19 4,778 4 3 5,711 34 27
2021 20,959 28 24 25,525 23 20 5,634 5 3 6,080 35 28

(1) NHTSA estimates alcohol involvement when alcohol test results are unknown.

Source: U.S. Department of Transportation, National Highway Safety Administration.

View Archived Tables


Additional resources

Insurance Institute for Highway Safety

National Highway Traffic Safety Administration 

The Motorcycle Safety Foundation

The Motorcycle Industry Council

Advocates for Highway and Auto Safety

Motorcycle Helmet Use Laws by State 


© Insurance Information Institute, Inc. - ALL RIGHTS RESERVED

Back to top

Auto
Facts + Statistics: Motorcycle crashes