MEMBERSHIP
AMPLIFY
EN ESPAÑOL
Connect With Us
- Popular search terms
- Automobile
- Home + Renters
- Claims
- Fraud
- Hurricane
- Popular Topics
- Automobile
- Home + Renters
- The Basics
- Disaster + Preparation
- Life Insurance
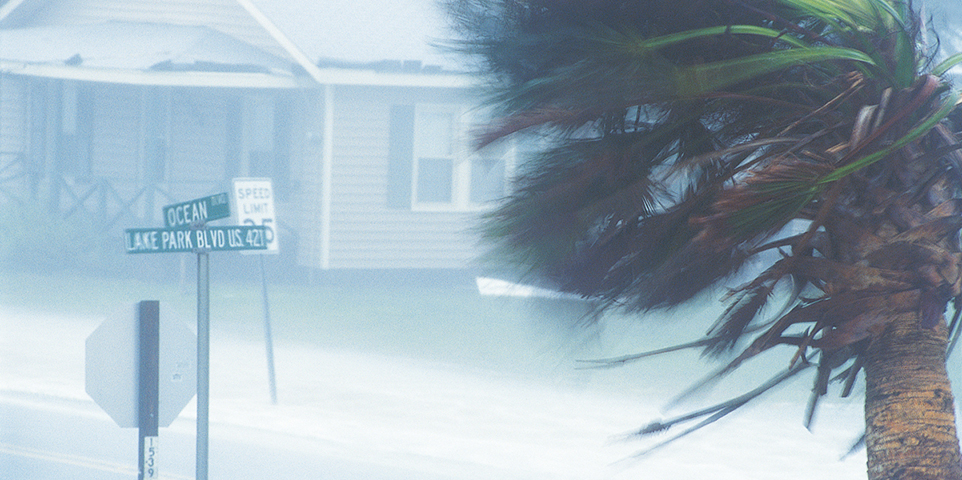
The official Atlantic hurricane season runs from June through November, but occasionally storms form outside those months. Seasonal hurricane forecasting from Colorado State University is available here.
According to the National Oceanic and Atmospheric Administration, a tropical cyclone is a rotating low-pressure weather system that has organized thunderstorms but no fronts, Hurricanes are tropical cyclones that have sustained winds of 74 mph. At this point a hurricane reaches Category 1 on the Saffir-Simpson Hurricane Wind Scale, which ranges from 1 to 5, based on the hurricane's intensity at the time of landfall at the location experiencing the strongest winds. The scale provides examples of the type of damage and impacts in the United States associated with winds of the indicated intensity. It does not address the potential for other hurricane-related phenomena such as storm surge, rainfall-induced floods and tornadoes.
The chart below shows insured losses in dollars for the top 10 costliest hurricanes in the United States when they occurred and in 2025 dollars adjusted for inflation. According to Aon, Katrina was the costliest hurricane on record, causing $65 billion in insured losses in 2005, including losses from the National Flood Insurance Program (NFIP). Losses from Katrina totaled $107.5 billion in 2025 dollars.
($ millions)
|
||||||||||||||||||||||||||||||||||||||||||||||||||||||||||||
(1) Includes Puerto Rico and the U.S. Virgin Islands and losses sustained by private insurers and government-sponsored programs such as the National Flood Insurance Program. Subject to change as loss estimates are further developed. As of January 2026.
(2) Adjusted for inflation by Aon using the U.S. Consumer Price Index.
Source: Aon.
|
(1) Atlantic Basin only.
(2) Includes fatalities from high winds of less than hurricane force from tropical storms.
Source: Insurance Information Institute from data supplied by the U.S. Department of Commerce, National Oceanic and Atmospheric Administration, National Hurricane Center, Puerto Rico Department of Health.
|
(1) Defined by the National Flood Insurance Program as an event that produces at least 1,500 paid losses, since 1978. As of January 2026.
Source: Federal Emergency Management Agency (FEMA) National Flood Insurance Program (NFIP) data; analysis courtesy of Aon.
|
(1) Combines materials, equipment and labor, but does not include the value of the land or lot.
Source: CotalityTM, a property data and analytics company.
|
(1) Combines materials, equipment and labor, but does not include the value of the land or lot.
Source: CotalityTM, a property data and analytics company.
|
||||||||||||||||||||||||||||||
(1) The Miami, New York and Houston metro areas studied in this analysis are defined by the Core Based Statistical Areas (CBSAs) of that region. In Miami, this includes the Miami-Fort Lauderdale-Pompano Beach, FL area; in New York City, this includes the New York City-Newark-Jersey City, NY-NJ-PA area; in Houston, this includes Houston-The Woodlands-Sugarland, TX.
(2) Combines materials, equipment and labor, but does not include the value of the land or lot.
Source: CoreLogic®, a property data and analytics company.