By Lewis Nibbelin, Research Writer, Triple-I
While farm employment accounts for less than 2% of the U.S. workforce, the farming industry supports nearly 49 million more jobs across the economy, particularly through the processing, distribution, and sale of agricultural products. Behind an estimated $10.4 trillion in output, the stability of the farm workforce and operations is a concern for every business in this supply chain, including insurers.
Given that footprint, nationwide shifts in farm employment and the methods used to evaluate it are highlighted in Triple-I’s Chart of the Week.
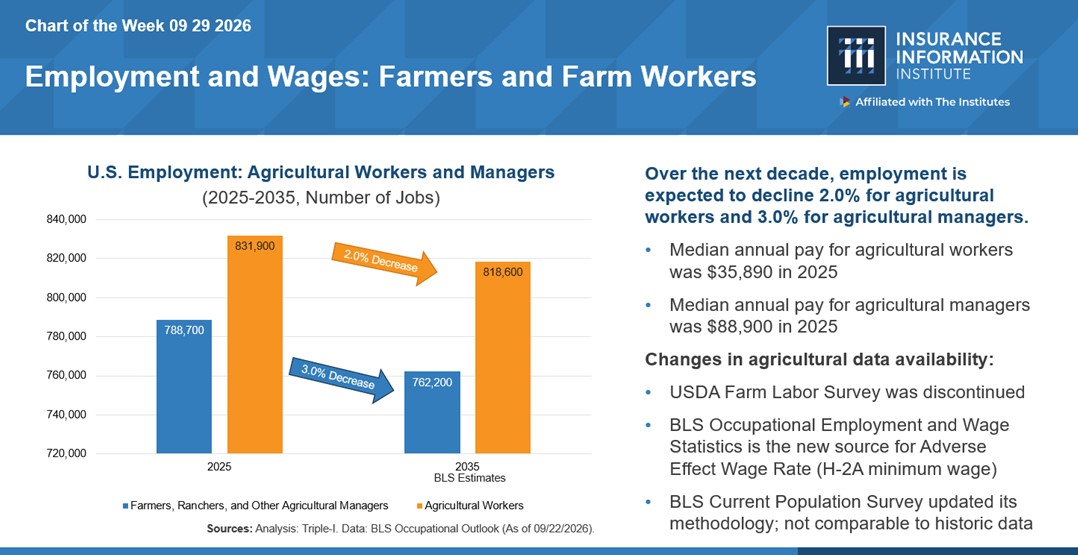
Based on data from the Bureau of Labor Statistics (BLS), employment of farm workers is projected to fall 2% from 2025 to 2035, dropping from 831,900 to 818,600 jobs. Employment among farm owners and other agricultural managers is estimated to drop by 3% during the same period, from 788,700 to 762,200.
Mechanization and other sources of efficiency gains contribute to fewer, larger farms and reduced employment rates. Profitability challenges may also help explain the trend. Nearly six in 10 farmers reported worsening finances in a 2026 study from the American Farm Bureau Federation, citing rising fertilizer and diesel prices in recent years.
Adjusted for inflation, net farm income is forecast to decrease by $9.1 billion from 2025 to 2026, according to the U.S. Department of Agriculture (USDA). Production expenses are forecast to increase by $21.2 billion, with total farm sector debt expected to reach a record $605.1 billion. Though the agricultural trade deficit is expected to improve this year, it exceeded a historic $41 billion in 2025, continuing a streak of negative yearly agricultural trade balances since 2019.
Labor shortages have plagued the farming industry for more than a decade, exacerbated by the COVID-19 pandemic and ongoing uncertainty surrounding U.S. immigration policies. An aging farm workforce adds to the strain, with those 65 and older comprising over 40% of total farmers – raising the average age of U.S. farmers to about 58 years old. To fill the gap, many U.S. farmers hire H-2A agricultural workers, or nonimmigrant workers who provide temporary or seasonal labor through the H-2A visa program.
Since 2013, H-2A holders have quadrupled to a reported sixth of the agricultural labor force, with over 400,000 requests for such workers filed in fiscal year 2025, for the first time in the visa program’s history. Both their wages and those for all farm workers are largely influenced by the Adverse Effect Wage Rate (AEWR), or the minimum wage required for H-2A employees set by the U.S. Department of Labor. Rates vary by region and are designed to “protect workers in the U.S. from adverse effects on their wages or working conditions resulting from hiring foreign workers.” Since their inception, AEWRs were based on results from the USDA’s Farm Labor Survey until the survey was discontinued in August 2025.
Effective October 2025, the Department of Labor issued an interim final rule to change how AEWRs are calculated. Key changes include:
- New data source. AEWRs now use state-level data from the BLS Occupational Employment and Wage Statistics (OEWS)
- New wage categories. AEWRs are divided into new skill and occupation-based categories, each with a unique rate.
- Housing cost adjustments. Employers who provide free housing to H-2A workers can now deduct housing costs from their wages, with adjustments varying by state.
Unlike the Farm Labor Survey, the OEWS collects data from nonfarm industries only. While third-party agricultural businesses such as farm labor contractors are included, they might not pay the same average wages to workers as those hired by farmers directly, creating a discrepancy in wage data. The OEWS was slated to begin collecting data from farms in 2026, but because the survey is designed to build its estimates over a three-year cycle, it will take years for this change to be fully reflected.
Under the new methodology, rates for some states and agricultural occupations rose while others fell. Nationally, the new average AEWR is approximately 10% less per hour, changing from $17.74 in 2025 to $15.96 as of August this year.
Though the updated AEWRs remain in place, a federal district court has ordered the Department of Labor to create a new methodology and replacement wage rates no later than Dec. 30. Per a public notice from the department, agricultural employers may need to make back wage payments once the new calculations are solidified.
Taken together, these developments leave farm employers and workers without a stable reference point for wages, making finding, retaining, and budgeting for labor even more challenging.
Learn More:
Triple-I’s Farmowners Insurance Issues Brief
Farmowners’ Insurance: The Trends Behind a Challenging Market