Key Facts
- According to The Identity Theft Research Center (ITRC) Annual Data Breach Report, 2023 had a record high number of data compromises in the U.S. in a single year. A 72 percentage point hike from the previous all-time high number of compromises set in 2021. At least 353 million individuals were impacted.
- According to the FBI’s Internet Crime Report 2023, 880,418 complaints of cyber-crime were reported to the FBI by the public, a 10 percent increase from 2022. The potential total loss increased to $12.5 billion in 2023, up from $10.3 billion in 2022. California, Texas, and Florida had the highest number of cybercrime victims.
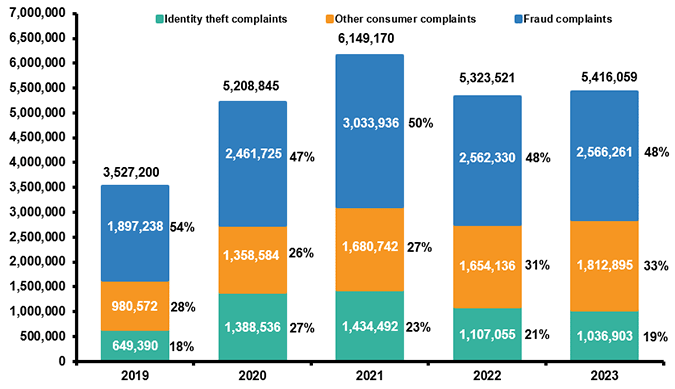
- The Federal Trade Commission’s (FTC) Consumer Sentinel Network took in over 5.39 million reports in 2023, of which 48 percent were for fraud and 19 percent for identity theft. Credit card fraud accounted for 40.2 percent of identify thefts, followed by miscellaneous identity theft at 25.1 percent, which includes online shopping and payment account fraud, email and social media fraud, and other identity theft. Georgia, Florida, and Nevada had the most identity theft reports.
Identity theft and fraud complaints
Identity Theft And Fraud Reports, 2019-2023 (1)
Top Five Types of Identity Theft, 2023 (1)
| Type of identity theft |
Number of reports |
Percent of total top five |
| Credit card fraud-new accounts |
381,122 |
42.0% |
| Miscellaneous identity theft (2) |
279,221 |
30.7 |
| Bank fraud-new accounts |
84,335 |
9.3 |
| Government benefits fraud-applied for/received |
82,419 |
9.1 |
| Loan fraud-business/personal loan |
81,342 |
9.0 |
| Total, top five |
908,439 |
100.0% |
(1) Consumers can report multiple types of identity theft. In 2023, 15 percent of identity theft reports included more than one type of identity theft.
(2) Includes online shopping and payment account fraud, email and social media fraud, and medical services, insurance and securities account fraud, and other identity theft.
Source: Federal Trade Commission, Consumer Sentinel Network.
Identity Theft By State, 2023
| State |
Reports per 100,000
population (1) |
Number of
reports |
Rank (2), (3) |
State |
Reports per 100,000
population (1) |
Number of
reports |
Rank (2), (3) |
| Alabama |
245 |
12,228 |
18 |
Nebraska |
137 |
2,673 |
38 |
| Alaska |
114 |
839 |
46 |
Nevada |
404 |
12,362 |
3 |
| Arizona |
262 |
18,539 |
16 |
New Hampshire |
138 |
1,892 |
37 |
| Arkansas |
169 |
5,071 |
28 |
New Jersey |
283 |
26,136 |
14 |
| California |
304 |
119,929 |
10 |
New Mexico |
134 |
2,825 |
39 |
| Colorado |
222 |
12,729 |
23 |
New York |
256 |
51,484 |
17 |
| Connecticut |
384 |
13,848 |
4 |
North Carolina |
243 |
25,142 |
19 |
| Delaware |
359 |
3,523 |
5 |
North Dakota |
118 |
913 |
45 |
| Florida |
438 |
93,547 |
2 |
Ohio |
294 |
34,616 |
12 |
| Georgia |
457 |
48,606 |
1 |
Oklahoma |
153 |
6,032 |
32 |
| Hawaii |
122 |
1,773 |
43 |
Oregon |
177 |
7,444 |
26 |
| Idaho |
123 |
2,223 |
42 |
Pennsylvania |
314 |
40,778 |
8 |
| Illinois |
307 |
39,314 |
9 |
Rhode Island |
216 |
2,357 |
24 |
| Indiana |
176 |
11,870 |
27 |
South Carolina |
294 |
14,931 |
12 |
| Iowa |
141 |
4,468 |
35 |
South Dakota |
94 |
833 |
50 |
| Kansas |
150 |
4,405 |
33 |
Tennessee |
185 |
12,709 |
25 |
| Kentucky |
119 |
5,340 |
44 |
Texas |
350 |
101,002 |
7 |
| Louisiana |
275 |
12,816 |
15 |
Utah |
165 |
5,345 |
29 |
| Maine |
126 |
1,714 |
40 |
Vermont |
97 |
620 |
49 |
| Maryland |
298 |
18,327 |
11 |
Virginia |
224 |
19,211 |
22 |
| Massachusetts |
351 |
24,540 |
6 |
Washington |
165 |
12,582 |
29 |
| Michigan |
235 |
23,621 |
20 |
West Virginia |
110 |
1,977 |
47 |
| Minnesota |
142 |
8,063 |
34 |
Wisconsin |
141 |
8,301 |
35 |
| Mississippi |
225 |
6,663 |
21 |
Wyoming |
106 |
609 |
48 |
| Missouri |
161 |
9,873 |
31 |
D.C. |
478 |
3,268 |
|
| Montana |
126 |
1,354 |
40 |
Puerto Rico |
51 |
1,690 |
|
(1) Population figures are based on the 2019 U.S. Census population estimates.
(2) States ranked per complaints per 100,000 population. States with the same number of complaints per 100,000 population receive the same rank.
(3) Excludes the District of Columbia and Puerto Rico.
Source: Federal Trade Commission, Consumer Sentinel Network.
See also the Identity Theft section of our website Click here.
Top 10 Writers Of Identity Theft Insurance By Direct Premiums Written, 2023 (1)
| Rank |
Group/company |
Direct premiums written (2) |
As a percent
of total direct
premiums written |
| 1 |
State Farm |
$36,014 |
14.9% |
| 2 |
Nationwide Mutual Group |
29,535 |
12.2 |
| 3 |
Travelers Companies Inc. |
23,104 |
9.6 |
| 4 |
Hanover |
15,598 |
6.5 |
| 5 |
Liberty Mutual |
12,767 |
5.3 |
| 6 |
American Family Insurance Group |
11,627 |
4.8 |
| 7 |
Erie Insurance |
10,956 |
4.5 |
| 8 |
Farmers Insurance Group of Companies |
10,672 |
4.4 |
| 9 |
Allstate Corp. |
9,420 |
3.9 |
| 10 |
Munich Re |
8,244 |
3.4 |
(1) Includes stand-alone policies and the cybersecurity portion of package policies. Does not include premiums from companies that cannot report premiums for cybersecurity coverage provided as part of package policies.
(2) Before reinsurance transactions
Source: NAIC data, sourced from S&P Global Market Intelligence, Insurance Information Institute.
Cybercrime
Number Of Data Compromises (1) And Individuals Impacted, 2015-2023
Cybercrime Complaints, 2019-2023 (1)
Top 10 States by Number of Cybercrime Victims and by Losses, 2023 (1)
| Rank |
State |
Number |
Rank |
State |
Losses
($ millions) |
| 1 |
California |
77,271 |
1 |
California |
$2,159.5 |
| 2 |
Texas |
47,305 |
2 |
Texas |
1,021.6 |
| 3 |
Florida |
41,061 |
3 |
Florida |
874.7 |
| 4 |
New York |
26,948 |
4 |
New York |
750.0 |
| 5 |
Ohio |
17,864 |
5 |
New Jersey |
441.2 |
| 6 |
Arizona |
16,584 |
6 |
Pennsylvania |
360.3 |
| 7 |
Pennsylvania |
16,407 |
7 |
Illinois |
335.8 |
| 8 |
Illinois |
15,783 |
8 |
Arizona |
324.4 |
| 9 |
Michigan |
14,784 |
9 |
Georgia |
301.0 |
| 10 |
Washington |
14,600 |
10 |
Washington |
288.7 |
(1) Based on the total number of complaints submitted to the Internet Crime Complaint Center via its website from each state where the complainant provided state information.
Source: Internet Crime Complaint Center.
Top 10 Writers of Cybersecurity Insurance by Direct Premiums Written, 2023 (1)
| Rank |
Group/company |
Direct premium written (2) |
As a percent of tota
direct premiums written |
| 1 |
Chubb Ltd. |
$573,583 |
7.9% |
| 2 |
AXA |
487,196 |
6.7 |
| 3 |
Fairfax Financial Holdings |
462,954 |
6.4 |
| 4 |
Travelers Companies Inc. |
384,851 |
5.3 |
| 5 |
Tokio Marine |
377,857 |
5.2 |
| 6 |
Berkshire Hathaway Inc. |
289,300 |
4.0 |
| 7 |
Arch Capital |
282,136 |
3.9 |
| 8 |
American International Group (AIG) |
274,377 |
3.8 |
| 9 |
Sompo |
262,948 |
3.6 |
| 10 |
Starr International Co. |
260,014 |
3.6 |
(1) Includes stand-alone policies and the cybersecurity portion of package policies. Does not include premiums from companies that cannot report premiums for cybersecurity coverage provided as part of package policies.
(2) Before reinsurance transactions.
Source: NAIC data, sourced from S&P Global Market Intelligence, Insurance Information Institute.
Additional resources