MEMBERSHIP
AMPLIFY
EN ESPAÑOL
Connect With Us
- Popular search terms
- Automobile
- Home + Renters
- Claims
- Fraud
- Hurricane
- Popular Topics
- Automobile
- Home + Renters
- The Basics
- Disaster + Preparation
- Life Insurance
(2024 US$ billions)
|
(1) Natural disasters that cause at least US$25 million in insured losses; or 10 deaths; or 50 people injured; or 2,000 filed claims or homes and structures damaged. As of January 2025.
(2) Chart total and amount cited in text may be different due to rounding by the source, Aon
Note: Loss data shown here may differ from figures shown elsewhere for the same event due to differences in the date of publication, the geographical area covered and other criteria used by organizations collecting the data.
Source: Aon.
(2024 US$ billions)
|
||||||||||||||||||||||||||||||||||||||||||||||||||||||||||||||||||||||||
(1) Natural disasters that cause at least US$25 million in insured losses; or 10 deaths; or 50 people injured; or 2,000 filed claims or homes and structures damaged. Losses for hurricanes in the United States include losses for the National Flood Insurance Program. As of January 2025.
(2) Adjusted for inflation by Aon using the U.S. Consumer Price Index.
Note: Loss data shown here may differ from figures shown elsewhere for the same event due to differences in the date of publication, the geographical area covered and other criteria used by organizations collecting the data.
Source: Aon.
|
(1) Natural disasters that cause at least 10 deaths. As of January 2025.
~ =Approximately.
Source: Aon.
|
(1) Natural disasters that cause at least 10 deaths. Does not include drought or heatwave events. As of January 2025.
Source: Aon.
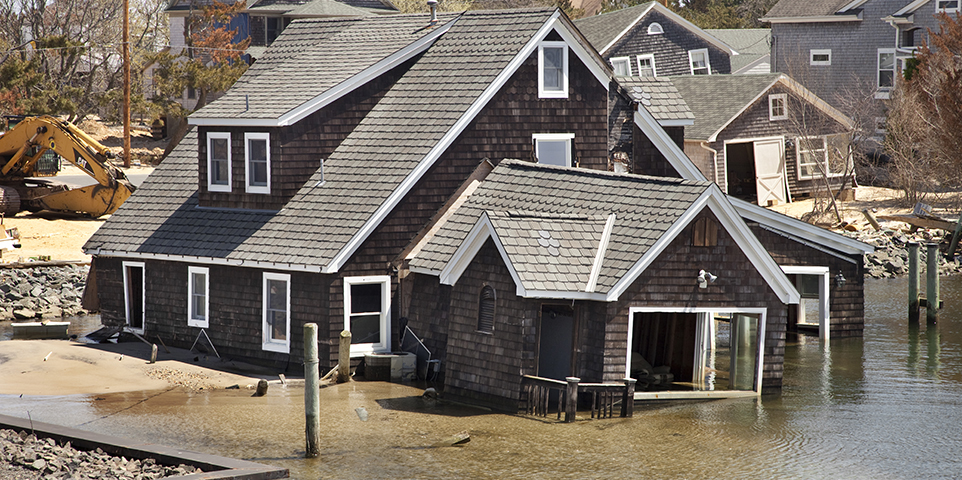
(2024 US$ billions)
|
||||||||||||||||||||||||||||||||||||||||||||||||||||||||||||||||||||||||
(1) Includes losses sustained by private insurers and government-sponsored programs. Subject to change as loss estimates are further developed. As of January 2025.
(2) Adjusted for inflation by Aon using the U.S. consumer price index.
Note: Loss data shown here may differ from figures shown elsewhere for the same event due to differences in the date of publication, the geographical area covered and other criteria used by organizations collecting the data.
Source: Aon.
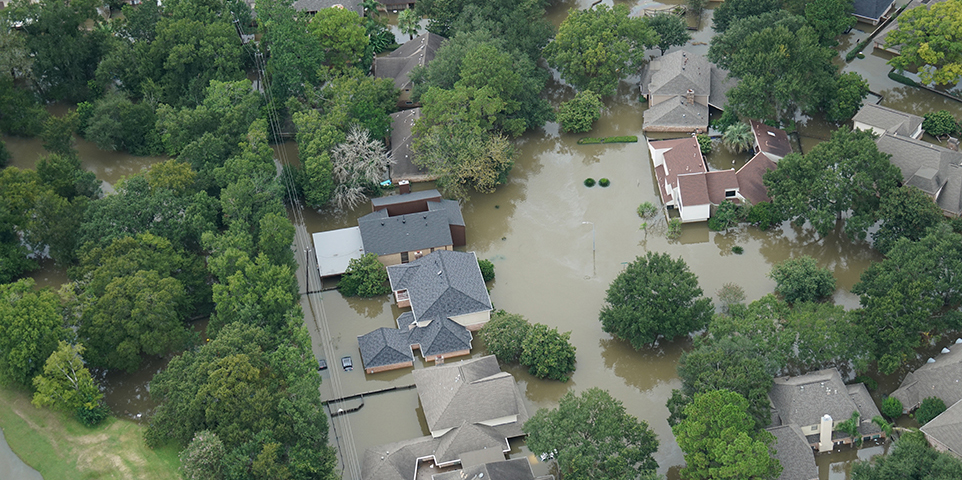
(2024 US$ billions)
|
||||||||||||||||||||||||||||||||||||||||||||||||||||||||||||||||||||||||
(1) Includes severe convective storms such as thunderstorms, tornadoes and hailstorms, straight-line winds and flooding that could occur with these storms. Includes losses sustained by private insurers and government-sponsored programs. Subject to change as loss estimates are further developed. As of January 2025.
(2) Adjusted for inflation by Aon using the U.S. consumer price index.
Note: Loss data shown here may differ from figures shown elsewhere for the same event due to differences in the date of publication, the geographical area covered and other criteria used by organizations collecting the data.
Source: Aon.
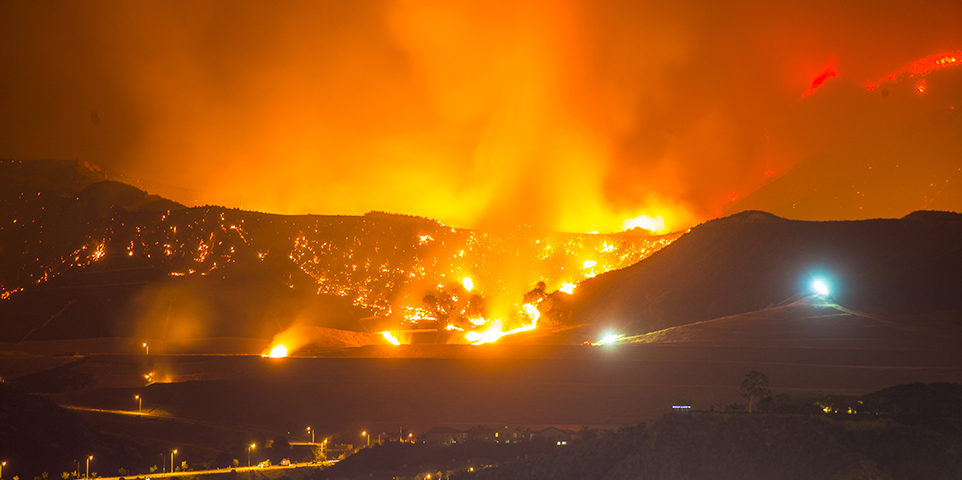
(2024 US$ billions)
|
||||||||||||||||||||||||||||||||||||||||||||||||||||||||||||||||||||||||
(1) Individual wildfires. Includes losses sustained by private insurers and government-sponsored programs. Subject to change as loss estimates are further developed. As of January 2025.
(2) Adjusted for inflation by Aon using the U.S. consumer price index.
Note: Loss data shown here may differ from figures shown elsewhere for the same event due to differences in the date of publication, the geographical area covered and other criteria used by organizations collecting the data.
Source: Aon.
The International Atomic Energy Agency (IAEA) rates the severity of nuclear incidents on the International Nuclear and Radiological Event Scale (INES) from one (indicating an anomaly) to seven (indicating a major event). The scale considers an event’s impact based on three criteria: its effect on people and the environment; whether it caused unsafe levels of radiation in a facility; and if preventive measures did not function as intended. Scales six and seven designate full meltdowns, where the nuclear fuel reactor core overheats and melts. Partial meltdowns, in which the fuel is damaged, are rated four or five.
|
(1) International Nuclear and Radiological Event Scale.
Source: International Atomic Energy Agency. INES Flyer.
Insurance Catastrophe Loss Review: Oil Spills: View PowerPoint Presentation slides.