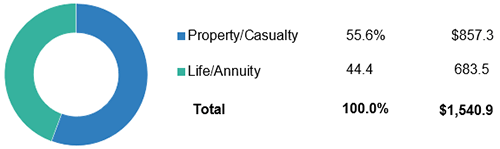
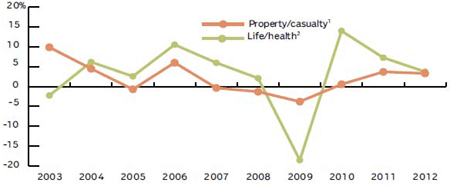
Net Premiums Written, Property/Casualty And Life/Annuities
There are three main insurance sectors: property/casualty (P/C), mainly auto, home and commercial insurance; life/annuity, mainly life insurance and annuity products; and private health insurance, written by insurers whose main business is health insurance. Life/annuity and P/C insurers can also write health coverage.
Net Premiums Written, Property/Casualty And Life/Annuity Insurance, 2014-2023
| Year |
Property/casualty (1) |
Life/annuity (2) |
Total |
| 2014 |
$502,578,473 |
$644,479,853 |
$1,147,058,326 |
| 2015 |
520,047,073 |
635,549,216 |
1,155,596,289 |
| 2016 |
533,744,458 |
597,634,158 |
1,131,378,616 |
| 2017 |
558,157,401 |
594,906,580 |
1,153,063,981 |
| 2018 |
617,931,313 |
599,149,141 |
1,217,080,454 |
| 2019 |
639,336,652 |
684,834,322 |
1,324,170,974 |
| 2020 |
655,589,295 |
629,241,674 |
1,284,830,969 |
| 2021 |
715,937,546 |
641,025,386 |
1,356,962,932 |
| 2022 |
776,693,264 |
709,057,636 |
1,485,750,900 |
| 2023 |
857,326,020 |
683,536,790 |
1,540,862,810 |
| Percent change |
|
|
|
| 2014-2023 |
70.6% |
6.1% |
34.3% |
| 2022-2023 |
10.4 |
-3.6 |
3.7 |
(1) Net premiums written before reinsurance transactions, excludes state funds, includes accident and health insurance.
(2) Includes premiums, annuity considerations (fees for annuity contracts), deposit-type funds and accident and health insurance.
Source: NAIC data, sourced from S&P Global Market Intelligence, Insurance Information Institute.
Direct Premiums Written, Property/Casualty and Life/Annuity Insurance, 2016-2025
| Year |
Property/casualty (1) |
Life/annuity (2) |
Total |
| 2016 |
$613,383,327 |
$677,704,031 |
$1,291,087,358 |
| 2017 |
642,531,528 |
687,279,884 |
1,329,811,412 |
| 2018 |
678,279,439 |
732,088,541 |
1,410,367,980 |
| 2019 |
712,471,198 |
768,019,838 |
1,480,491,036 |
| 2020 |
728,998,689 |
773,650,404 |
1,502,649,093 |
| 2021 |
798,702,031 |
827,717,052 |
1,626,419,083 |
| 2022 |
876,177,259 |
865,857,817 |
1,742,035,076 |
| 2023 |
968,655,396 |
915,302,335 |
1,883,957,731 |
| 2024 |
1,061,681,498 |
1,047,593,037 |
2,109,274,535 |
| 2025 |
1,113,067,501 |
1,090,428,811 |
2,203,496,312 |
| Percent change |
|
|
|
| 2016 to 2025 |
81.5% |
60.9% |
70.7% |
| 2024 to 2025 |
4.8 |
4.1 |
4.5 |
(1) Direct premiums written before reinsurance transactions, excludes state funds, includes accident and health insurance.
(2) Includes premiums, annuity considerations (fees for annuity contracts), deposit-type funds and accident and health insurance.
Source: NAIC data, sourced from S&P Global Market Intelligence: Core Financial Pages, Insurance Information Institute.