The Northridge, California, earthquake of 1994 was the costliest earthquake in U.S. history in terms of insured losses.
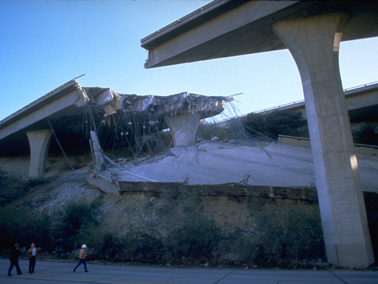
 Damaged portion of the Golden State Freeway at Gavin Canyon, January 17, 1994.
Source: FEMA/Wikipedia
Affecting much of southern California, the Northridge, California, earthquake of January 17, 1994 was the costliest earthquake in U.S. history in terms of insured losses (both actual and adjusted for inflation). The event, which triggered the fastest ground acceleration rates (intensity of shaking) ever recorded up to that time, caused 57 fatalities, approximately 8,800 injuries, and more than $20 billion dollars in property losses (2013 USD) to buildings and public infrastructure.
As 20 years have passed since the Northridge earthquake, numerous advances have changed how we deal with seismic activity in developed areas. Advances in civil and structural engineering, as well as emergency preparedness and rescue efforts have helped to mitigate the human toll of earthquakes. More effective communications, and widespread use of digital media and the Internet in particular, have fostered greater awareness of earthquake safety, and have changed how people share and consume information before, during and after catastrophes. Yet, in spite of these advances (or maybe because of them), fewer than 10 percent of California property and business owners today opt to purchase earthquake insurance coverage.
On the anniversary of the Northridge earthquake, the Insurance Information Institute offers resources, facts and statistics on earthquakes and insurance.
Top 10 Costliest World Earthquakes And Tsunamis By Insured Losses, 1980-2020 (1)
| |
|
|
Losses |
|
| |
|
|
|
Insured losses |
|
| Rank |
Date |
Location |
Overall |
When occurred |
In 2020 dollars |
Fatalities |
| 1 |
Mar. 11, 2011 |
Japan: Aomori, Chiba, Fukushima, lbaraki, lwate,
Miyagi, Tochigi, Tokyo, Yamagata. Includes tsunami. |
$210,000 |
$40,000 |
$46,378 |
15,880 |
| 2 |
Feb. 22, 2011 |
New Zealand: Canterbury, Christchurch, Lyttelton |
24,000 |
16,500 |
19,318 |
185 |
| 3 |
Jan. 17, 1994 |
USA (CA): Northridge, Los Angeles, San Fernando Valley,
Ventura, Orange |
44,000 |
15,300 |
27,115 |
61 |
| 4 |
Feb. 27, 2010 |
Chile: Concepcion, Metropolitana, Rancagua, Talca,
Temuco, Valparaiso. Includes tsunami. |
30,000 |
8,000 |
9,564 |
520 |
| 5 |
Sep. 4, 2010 |
New Zealand: Canterbury, Christchurch, Avonside,
Omihi, Timaru, Kaiapoi, Lyttelton |
10,000 |
7,400 |
8,778 |
0 |
| 6 |
Apr. 14-16, 2016 |
Japan: Kumamoto, Aso, Chuo Ward, Mashiki, Minamiaso,
Oita, Miyazaki, Fukuoka, Yamaguchi |
32,000 |
6,500 |
7,039 |
205 |
| 7 |
Jan. 17, 1995 |
Japan: Hyogo, Kobe, Osaka, Kyoto |
100,000 |
3,000 |
5,172 |
6,430 |
| 8 |
Nov. 13, 2016 |
New Zealand: Canterbury, Kaikoura, Waiau,
Wellington, Marlborough, Picton |
3,900 |
2,100 |
2,254 |
2 |
| 9 |
Jun. 13, 2011 |
New Zealand: Canterbury, Christchurch, Lyttelton |
2,700 |
2,100 |
2,411 |
1 |
| 10 |
Sep. 19, 2017 |
Mexico: Puebla, Morelos, Greater Mexico City |
6,000 |
2,000 |
2,100 |
369 |
(1) Data through 2020 as of March 2021. Ranked on insured losses when occurred. Updated by the Insurance Information Institute using data from Munich Re’s Relevant geophysical events worldwide 1980-2018.
(2) Based on property losses including, if applicable, agricultural, offshore, marine, aviation and National Flood Insurance Program losses in the United States and may differ from data shown elsewhere.
Source: © 2021 Munich Re, Geo Risks Research; Wikipedia.