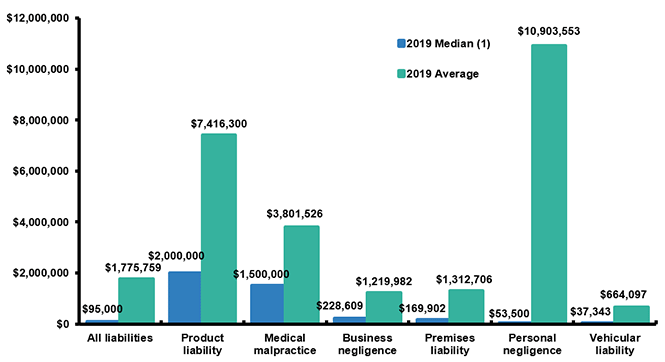
(1) Represents the midpoint jury award. Half of awards are above the median and half are below.
Source: Reprinted with permission of Thomson Reuters, Current Award Trends in Personal Injury, 60th edition.

12 graphs in this archive
(1) Represents the midpoint jury award. Half of awards are above the median and half are below.
Source: Reprinted with permission of Thomson Reuters, Current Award Trends in Personal Injury, 60th edition.
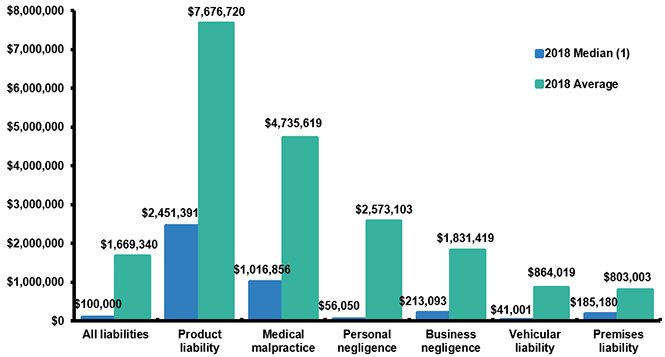
(1) Represents the midpoint jury award. Half of awards are above the median and half are below.
Source: Reprinted with permission of Thomson Reuters, Current Award Trends in Personal Injury, 59th edition.
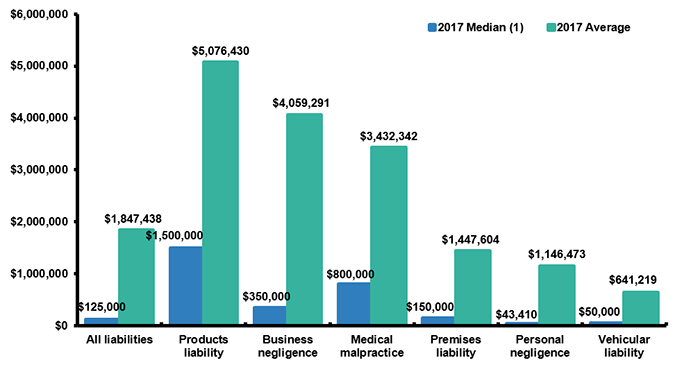
(1) Represents the midpoint jury award. Half of awards are above the median and half are below.
Source: Reprinted with permission of Thomson Reuters, Current Award Trends in Personal Injury, 58th edition.
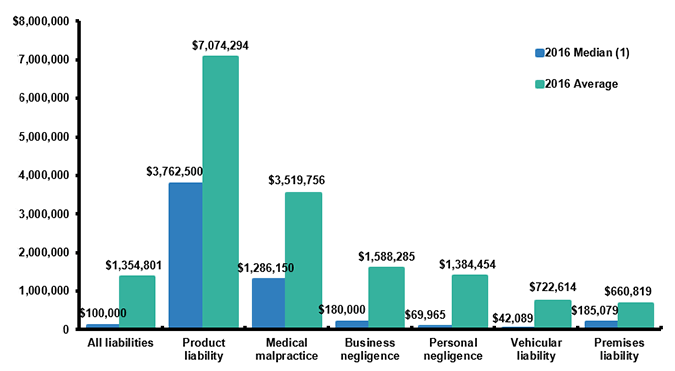
(1) Represents the midpoint jury award. Half of awards are above the median and half are below.
Source: Reprinted with permission of Thomson Reuters, Current Award Trends in Personal Injury, 57th edition.
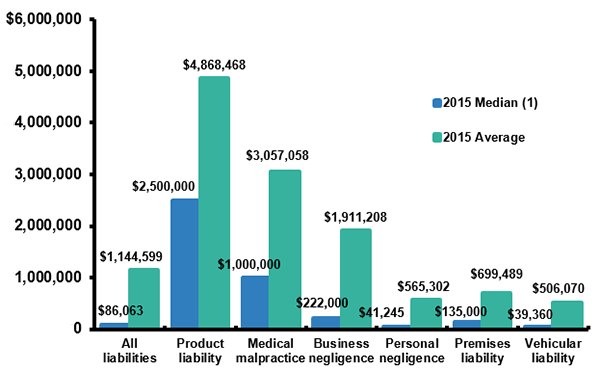
(1) Represents the midpoint jury award. Half of the awards are above the median and half are below.
Source: Reprinted with permission of Thomson Reuters, Current Award Trends in Personal Injury, 56th edition.
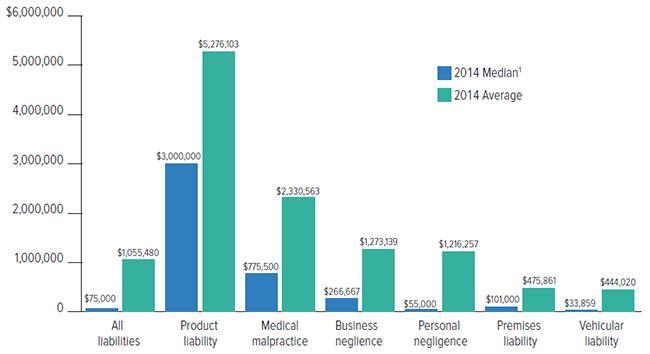
(1) Represents the midpoint jury award. Half of the awards are above the median and half are below.
Source: Reprinted with permission of Thomson Reuters, Current Award Trends in Personal Injury, 55th edition.
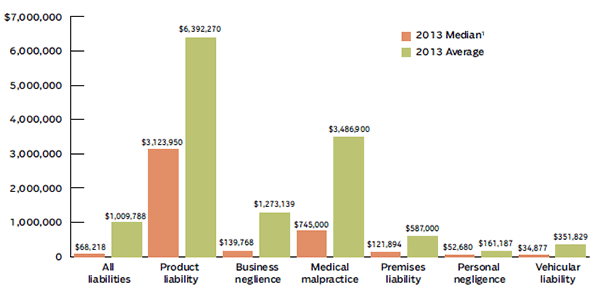
(1) Represents the midpoint jury award. Half of the awards are above the median and half are below.
Source: Reprinted with permission of Thomson Reuters, Current Award Trends in Personal Injury, 54th edition.
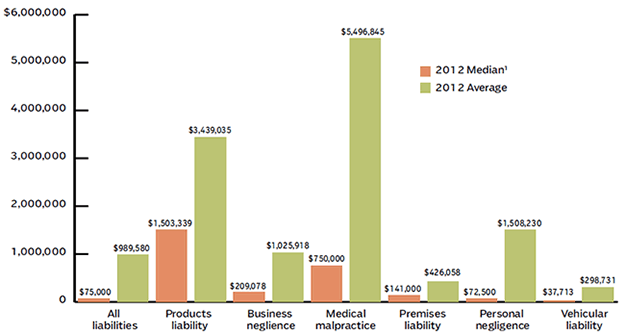
(1) Represents the midpoint jury award. Half of the awards are above the median and half are below.
Source: Reprinted with permission of Thomson Reuters, Current Award Trends in Personal Injury, 53rd edition.
(1) Represents the midpoint jury award. Half of the awards are above the median and half are below.
Source: Thomson Reuters, Jury Verdict Research Series.
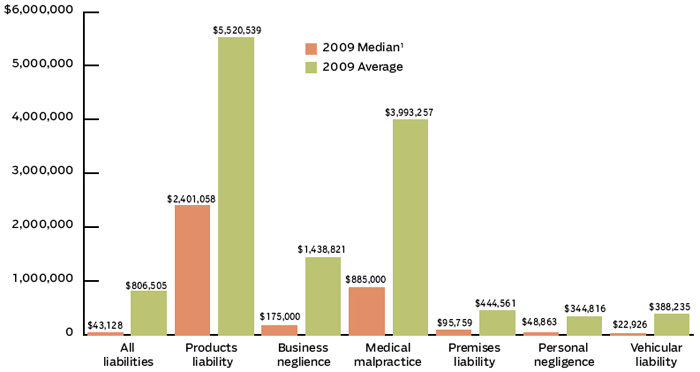
(1) Represents the midpoint jury award. Half of awards are above the median and half are below.
Source: Jury Verdict Research.
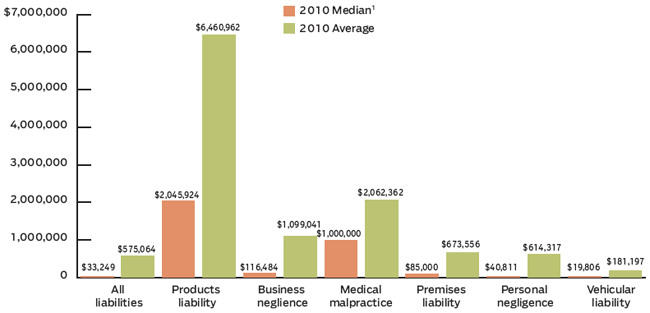
(1) Represents the midpoint jury award. Half of awards are above the median and half are below.
Source: Thomson Reuters.