MEMBERSHIP
AMPLIFY
EN ESPAÑOL
Connect With Us
- Popular search terms
- Automobile
- Home + Renters
- Claims
- Fraud
- Hurricane
- Popular Topics
- Automobile
- Home + Renters
- The Basics
- Disaster + Preparation
- Life Insurance
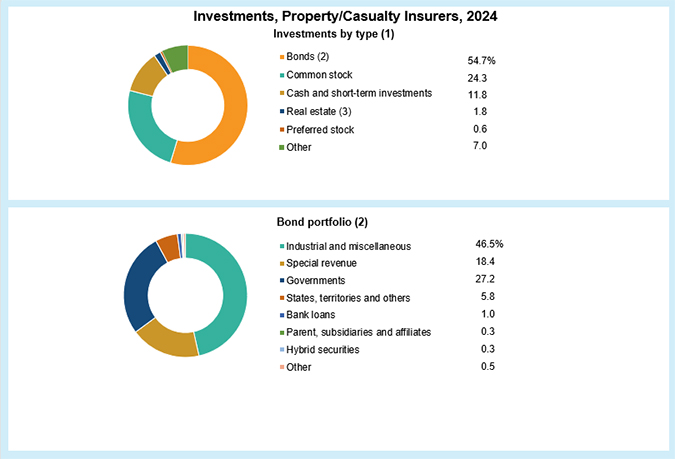
(1) Cash and invested net admitted assets, as of December 31, 2024.
(2) Bonds represents 54.7% of total investments.
(3) Includes mortgage loans on real estate.
Source: NAIC data, sourced from S&P Global Market Intelligence, Insurance Information Institute.
(1) Cash and invested net admitted assets, as of December 31, 2011.
Source: SNL Financial LC.
(1) Cash and invested net admitted assets, as of December 31, 2010.
(2) Long-term bonds with maturity dates over one year.
Source: SNL Financial LC.
(1) Cash and invested net admitted assets, as of December 31, 2009.
(2) Long-term bonds with maturity dates over one year.
Source: SNL Financial LC.
(1) Cash and invested assets, as of December 31, 2008.
(2) Long-term bonds with maturity dates over one year.
Source: National Association of Insurance Commissioners (NAIC) Annual Statement Database, via Highline Data, LLC.. Copyrighted information. No portion of this work may be copied or redistributed without the express written permission of Highline Data, LLC.
(1) Cash and invested net admitted assets, as of December 31, 2013.
Source: SNL Financial LC.
(1) Cash and invested net admitted assets, as of December 31, 2014.
(2) Includes mortgage loans on real estate.
Source: SNL Financial LC.
(1) Cash and invested net admitted assets, as of December 31, 2015.
(2) Includes mortgage loans on real estate.
Source: NAIC data, sourced from S&P Global Market Intelligence, Insurance Information Institute.
(1) Cash and invested net admitted assets, as of December 31, 2016.
(2) Includes mortgage loans on real estate.
Source: NAIC data, sourced from S&P Global Market Intelligence, Insurance Information Institute.
(1) Cash and invested net admitted assets, as of December 31, 2017.
(2) Includes mortgage loans on real estate.
Source: NAIC data, sourced from S&P Global Market Intelligence, Insurance Information Institute.
(1) Cash and invested net admitted assets, as of December 31, 2018.
(2) Includes mortgage loans on real estate.
Source: NAIC data, sourced from S&P Global Market Intelligence, Insurance Information Institute.
(1) Cash and invested net admitted assets, as of December 31, 2019.
(2) Includes mortgage loans on real estate.
*Bonds represents 57.05% of total investments.
Source: NAIC data, sourced from S&P Global Market Intelligence, Insurance Information Institute.
(1) Cash and invested net admitted assets, as of December 31, 2020.
(2) Includes mortgage loans on real estate.
*Bonds represents 55.38% of total investments.
Source: NAIC data, sourced from S&P Global Market Intelligence, Insurance Information Institute.
(1) Cash and invested net admitted assets, as of December 31, 2021.
(2) Includes mortgage loans on real estate.
*Bonds represents 53.02% of total investments.
Source: NAIC data, sourced from S&P Global Market Intelligence, Insurance Information Institute.
(1) Cash and invested net admitted assets, as of December 31, 2022.
(2) Includes mortgage loans on real estate.
*Bonds represents 55.31% of total investments.
Source: NAIC data, sourced from S&P Global Market Intelligence, Insurance Information Institute.
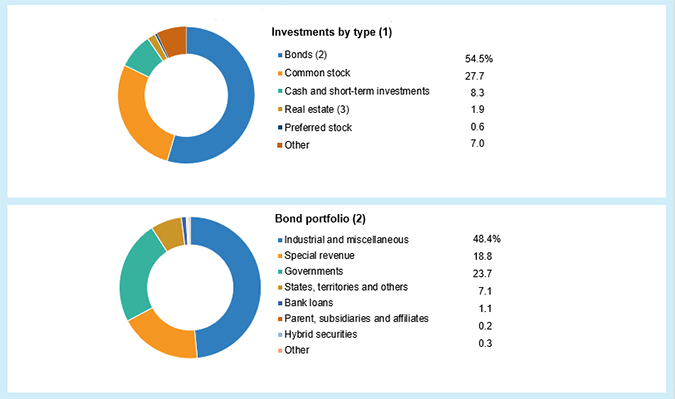
(1) Cash and invested net admitted assets, as of December 31, 2023.
(2) Bonds represents 54.5% of total investments.
(3) Includes mortgage loans on real estate.
Source: NAIC data, sourced from S&P Global Market Intelligence, Insurance Information Institute.