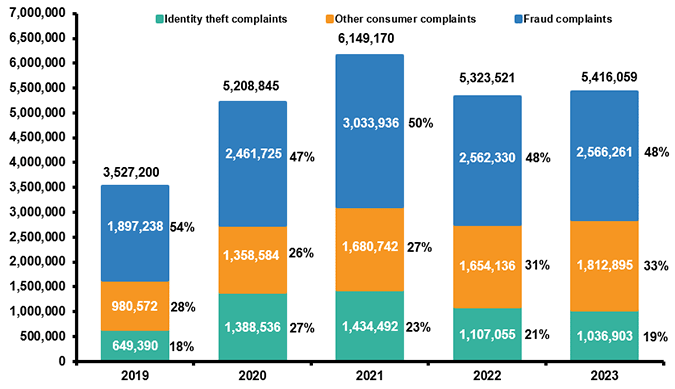
(1) Percentages are based on the total number of Consumer Sentinel Network reports by calendar year. These figures exclude “Do Not Call” registry complaints.
Source: Federal Trade Commission, Consumer Sentinel Network.

12 graphs in this archive
(1) Percentages are based on the total number of Consumer Sentinel Network reports by calendar year. These figures exclude “Do Not Call” registry complaints.
Source: Federal Trade Commission, Consumer Sentinel Network.
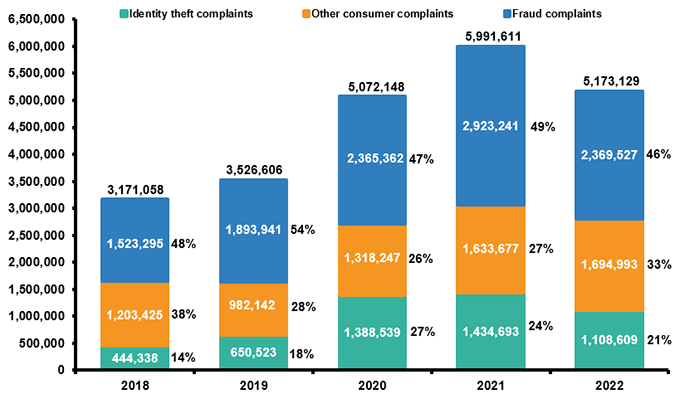
(1) Percentages are based on the total number of Consumer Sentinel Network reports by calendar year. These figures exclude “Do Not Call” registry complaints.
Source: Federal Trade Commission, Consumer Sentinel Network.
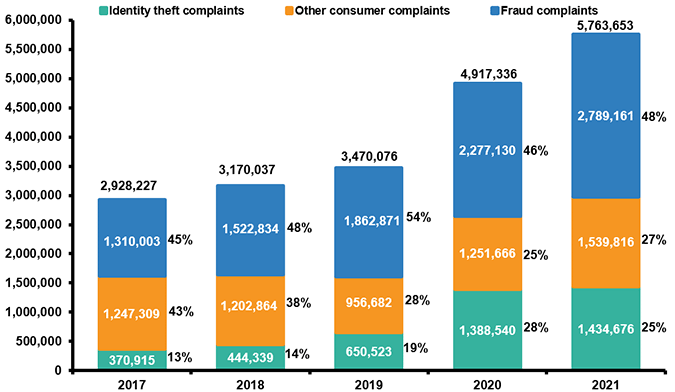
(1) Percentages are based on the total number of Consumer Sentinel Network reports by calendar year. These figures exclude “Do Not Call” registry complaints.
Source: Federal Trade Commission, Consumer Sentinel Network.
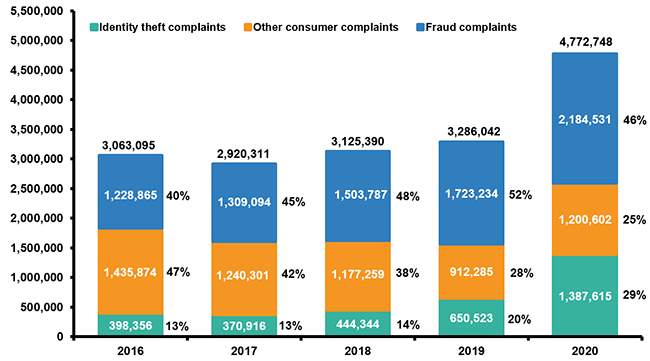
(1) Percentages are based on the total number of Consumer Sentinel Network reports by calendar year. These figures exclude “Do Not Call” registry complaints.
Source: Federal Trade Commission, Consumer Sentinel Network.
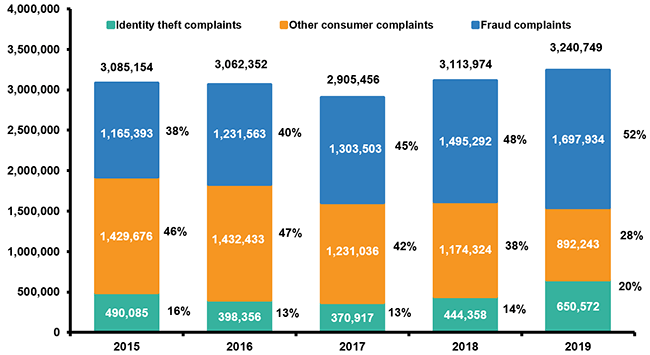
(1) Percentages are based on the total number of Consumer Sentinel Network reports by calendar year. These figures exclude “Do Not Call” registry complaints.
Source: Federal Trade Commission, Consumer Sentinel Network.
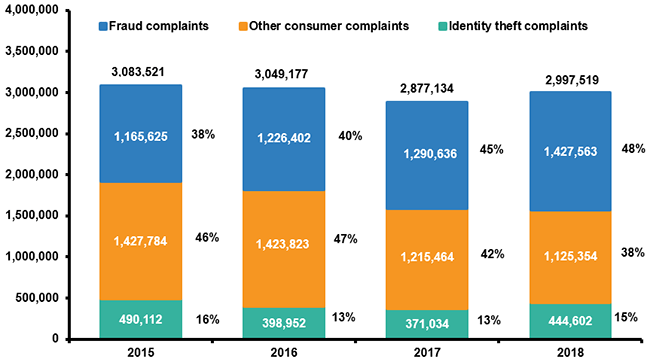
(1) Percentages are based on the total number of Consumer Sentinel Network reports by calendar year. These figures exclude “Do Not Call” registry complaints.
Source: Federal Trade Commission, Consumer Sentinel Network.
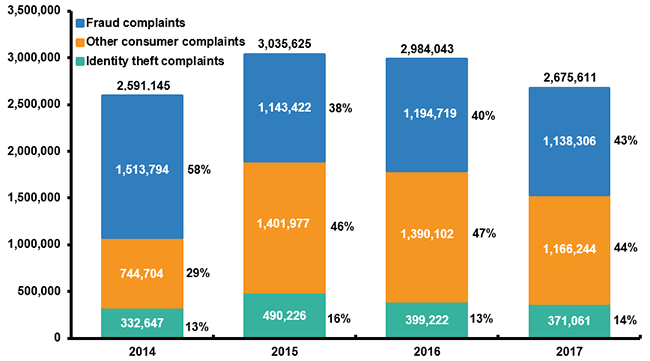
(1) Percentages are based on the total number of Consumer Sentinel Network reports by calendar year. These figures exclude “Do Not Call” registry complaints.
Source: Federal Trade Commission, Consumer Sentinel Network.
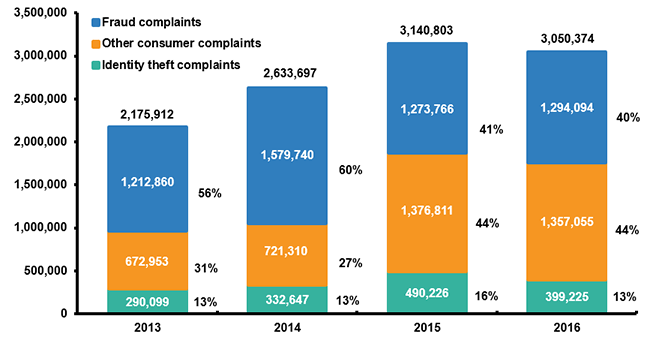
(1) Percentages are based on the total number of Consumer Sentinel Network complaints by calendar year. These figures exclude “Do Not Call” registry complaints.
Source: Federal Trade Commission, Consumer Sentinel Network.
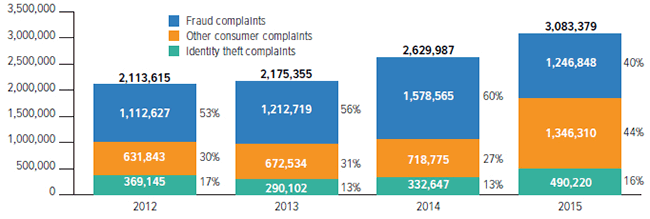
(1) Percentages are based on the total number of Consumer Sentinel Network complaints by calendar year. These figures exclude "Do Not Call" registry complaints.
Source: Federal Trade Commission, Consumer Sentinel Network.
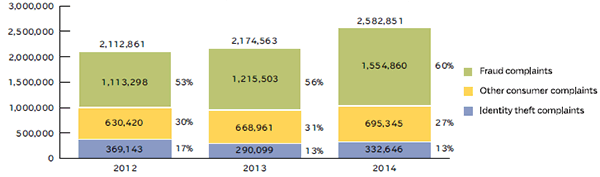
(1) Percentages are based on the total number of Consumer Sentinel Network complaints by calendar year. These figures exclude "Do Not Call" registry complaints.
Source: Federal Trade Commission.
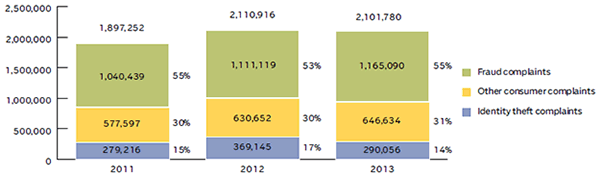
(1) Percentages are based on the total number of Consumer Sentinel Network complaints by calendar year. These figures exclude "Do Not Call" registry complaints.
Source: Federal Trade Commission.
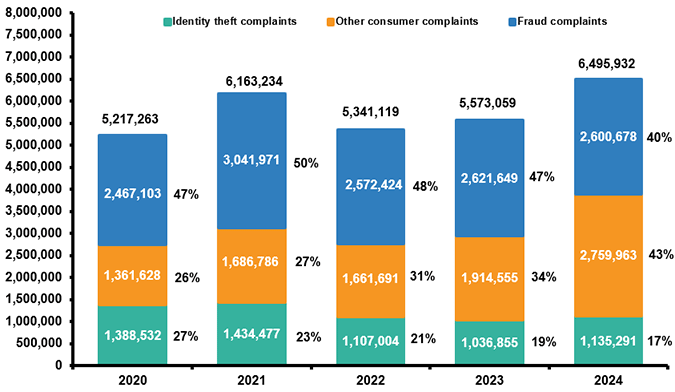
(1) Percentages are based on the total number of Consumer Sentinel Network reports by calendar year. These figures exclude “Do Not Call” registry complaints.
Source: Federal Trade Commission, Consumer Sentinel Network.