MEMBERSHIP
AMPLIFY
EN ESPAÑOL
Connect With Us
- Popular search terms
- Automobile
- Home + Renters
- Claims
- Fraud
- Hurricane
- Popular Topics
- Automobile
- Home + Renters
- The Basics
- Disaster + Preparation
- Life Insurance
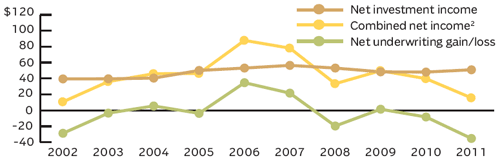
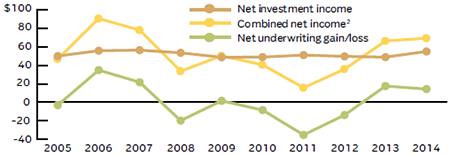
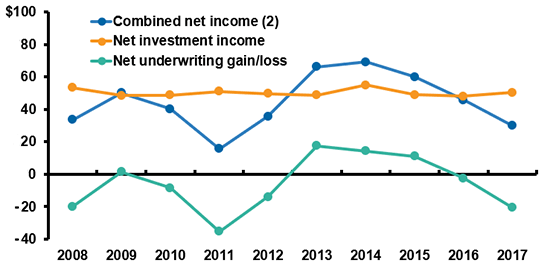
($ billions)
(1) Excludes state funds.
(2) Net underwriting gain/loss plus net investment income.
Source: SNL Financial LC.
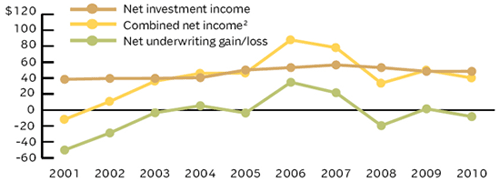
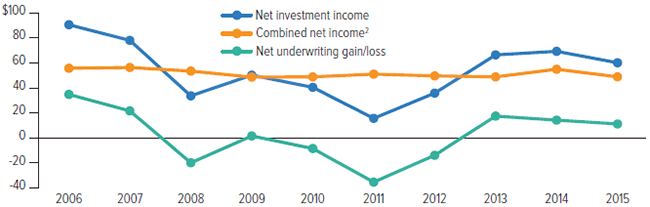
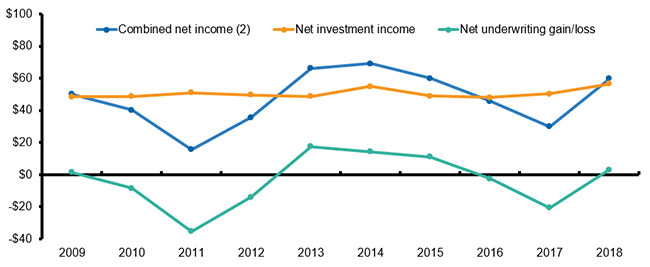
($ billions)
(1) Excludes state funds.
(2) Net underwriting gain/loss plus net investment income.
Source: SNL Financial LC.
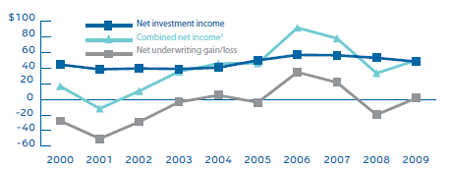
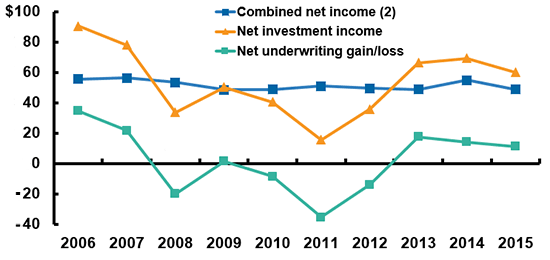
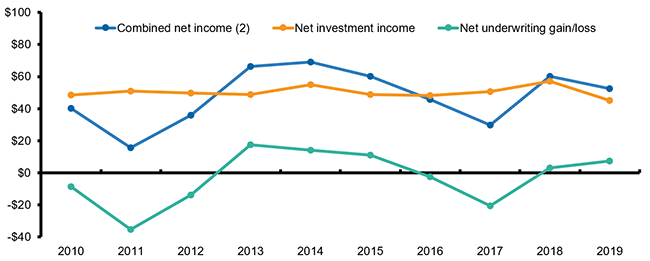
($ billions)
(1) Excludes state funds.
(2) Net underwriting gain/loss plus net investment income.
Source: SNL Financial LC.
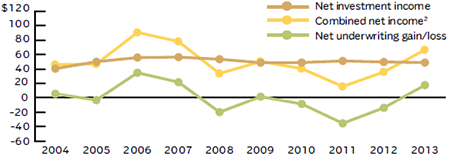
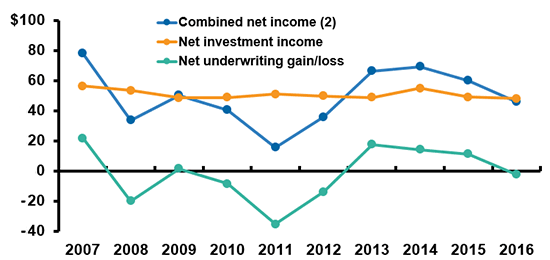
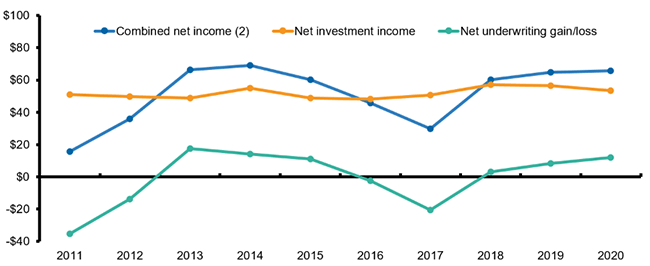
($ billions)
(1) Excludes state funds.
(2) Net underwriting gain/loss plus net investment income.
Source: SNL Financial LC.
($ billions)
(1) Excludes state funds.
(2) Net underwriting gain/loss plus net investment income.
Source: SNL Financial LC.
($ billions)
(1) Excludes state funds.
(2) Net underwriting gain/loss plus net investment income.
Source: NAIC data, sourced from S&P Global Market Intelligence, Insurance Information Institute.
($ billions)
(1) Excludes state funds.
(2) Net underwriting gain/loss plus net investment income.
Source: NAIC data, sourced from S&P Global Market Intelligence, Insurance Information Institute.
($ billions)
(1) Excludes state funds.
(2) Net underwriting gain/loss plus net investment income.
Source: NAIC data, sourced from S&P Global Market Intelligence, Insurance Information Institute.
($ billions)
(1) Excludes state funds.
(2) Net underwriting gain/loss plus net investment income.
Source: NAIC data, sourced from S&P Global Market Intelligence, Insurance Information Institute.
($ billions)
(1) Excludes state funds.
(2) Net underwriting gain/loss plus net investment income.
Source: NAIC data, sourced from S&P Global Market Intelligence, Insurance Information Institute.
($ billions)
(1) Excludes state funds.
(2) Net underwriting gain/loss plus net investment income.
Source: NAIC data, sourced from S&P Global Market Intelligence, Insurance Information Institute.
($ billions)
(1) Excludes state funds.
(2) Net underwriting gain/loss plus net investment income.
Source: NAIC data, sourced from S&P Global Market Intelligence, Insurance Information Institute.