(Percentage distribution)
MEMBERSHIP
AMPLIFY
EN ESPAÑOL
Connect With Us
- Popular search terms
- Automobile
- Home + Renters
- Claims
- Fraud
- Hurricane
- Popular Topics
- Automobile
- Home + Renters
- The Basics
- Disaster + Preparation
- Life Insurance
(Percentage distribution)
Source: © 2017 Munich Re, Geo Risks Research, NatCatSERVICE. As of February 2017.
(Number of relevant events by peril)
Source: © 2019 Munich Re, Geo Risks Research, NatCatSERVICE. As of March 2019.
(Number of relevant events by peril)
Source: © 2018 Munich Re, Geo Risks Research, NatCatSERVICE. As of January 2018.
Source: © 2017 Munich Re, Geo Risks Research, NatCatSERVICE. As of February 2017.
Source: © 2019 Munich Re, Geo Risks Research, NatCatSERVICE. As of March 2019.
Source: © 2018 Munich Re, Geo Risks Research, NatCatSERVICE. As of January 2018.
Source: © 2017 Munich Re, Geo Risks Research, NatCatSERVICE. As of February 2017.
(Percentage distribution)
Source: © 2019 Munich Re, Geo Risks Research, NatCatSERVICE. As of March 2019.
(Percentage distribution)
Source: © 2018 Munich Re, Geo Risks Research, NatCatSERVICE. As of January 2018.
(Percentage distribution)
Source: © 2017 Munich Re, Geo Risks Research, NatCatSERVICE. As of February 2017.
($ billions)
Source: NYSE Euronext; Securities Industry and Financial Markets Association.
Source: Swiss Re, sigma, No. 3/2008.
TOTAL AUTO PREMIUMS BY SECTOR, 2007
Source: National Association of Insurance Commissioners (NAIC) Annual Statement Database, via Highline Data, LLC. Copyrighted information. No portion of this work may be copied or redistributed without the express written permission of Highline Data, LLC.
PERCENT CHANGE FROM PRIOR YEAR, NET PREMIUMS WRITTEN, PRIVATE PASSENGER AUTO, 1999-2007
Source: National Association of Insurance Commissioners (NAIC) Annual Statement Database, via Highline Data, LLC. Copyrighted information. No portion of this work may be copied or redistributed without the express written permission of Highline Data, LLC.
WHERE THE REVENUE DOLLAR GOES, 2007
(Premiums and investments)
POPULATION GROWTH PROJECTIONS FOR HURRICANE EXPOSED STATES, 2000-2030
(000)
Source: U.S. Department of Commerce, Census Bureau.
WORLD LIFE AND NONLIFE INSURANCE PREMIUMS, 2007
Source: Swiss Re, sigma, No. 3/2008.
ASSETS OF HEDGE FUNDS, 1950-2008 (1)
($ billions)
(1) As of January.
Source: Hennessee Group LLC.
SEPARATELY MANAGED ACCOUNTS INDUSTRY ASSETS UNDER MANAGEMENT, 2003-2007
($ billions)
Source: Money Management Institute, Dover Financial Research.
TOTAL RECEIVABLES OUTSTANDING AT FINANCE COMPANIES BY CATEGORY, 2003 AND 2007 (1)
(1) Includes finance company subsidiaries of bank holding companies but not of retailers and banks. Includes owned receivables (carried on the balance sheet of the institution) and managed receivables (outstanding balances of pools upon which securities have been issued; these balances are no longer carried on the balance sheets of the loan originator).
Source: Board of Governors of the Federal Reserve System.
($ billions)
(1) Represents homeowners’ cash withdrawals from home mortgage refinance transactions. Includes prime conventional loans only and is net of retirement of outstanding second mortgages.
(2) Estimated.
Source: Freddie Mac.
(1) HECMs are federally insured reverse mortgage products.
(2) Through June 30, 2008; fiscal year ends September 30.
Source: National Reverse Mortgage Lenders Association.
(Percent)
Source: U.S. Department of Commerce, Census Bureau, Housing Vacancy Survey.
HOME OWNERSHIP RATES, 1900-2007
Source: U.S. Department of Commerce, U.S. Census Bureau, Census of Housing.
(1) Information technology expense per total company full-time employee.
Source: Ward Group.
Source: Ward Group.
(1) Information technology expense per total company full-time employee.
Source: Ward Group.
IT SPENDING AS A PERCENT OF TOTAL PREMIUMS WRITTEN BY LIFE, ANNUITIES AND HEALTH INSURANCE COMPANIES, 2002-2006
Source: Ward Group.
(1) Automated Clearing House.
Source: Board of Governors of the Federal Reserve System.
DEBT GROWTH BY SECTOR, 1998-2007 (Percent change from prior year)
Source: Board of Governors of the Federal Reserve System, June 5, 2008.
ASSETS OF PRIVATE PENSION FUNDS, 1945-2007
($ billions, end of year)
Source: Board of Governors of the Federal Reserve System, June 5, 2008.
($ billions)
Source: GC Securities, a division of MMC Securities Corp., a U.S. registered broker-dealer, member FINRA/SIPC, and Guy Carpenter.
($ billions)
Source: GC Securities, a division of MMC Securities Corp., a U.S. registered broker-dealer, member FINRA/SIPC, and Guy Carpenter.
GROWTH IN U.S. PREMIUMS, PROPERTY/CASUALTY AND LIFE/HEALTH INSURANCE, 1998-2007
(Percent change from prior year)
(1) Net premiums written, excluding state funds.
(2) Premiums and annuity considerations for life/health insurance companies. Includes deposit-type funds beginning in 2001.
Source: National Association of Insurance Commissioners (NAIC) Annual Statement Database, via Highline Data, LLC. Copyrighted information. No portion of this work may be copied or redistributed without the express written permission of Highline Data, LLC.
PREMIUMS BY TYPE OF INSURER, 2007 (1)
(1) Gross direct premiums. Total premiums for 2007 were $1,580 billion.
(2) Blue Cross/Blue Shield, HMOs and hospital, medical and dental indemnity.
Source: National Association of Insurance Commissioners. Reprinted with permission. Further reprint or distribution strictly prohibited without written permission of NAIC
THE NATION'S HEALTHCARE DOLLAR: 2006 WHERE IT COMES FROM (1)
(1) Does not add to 100 percent due to rounding.
(2) State Children’s Health Insurance Program.
Source: Centers for Medicare and Medicaid Services, Office of the Actuary.
NATIONAL HEALTHCARE EXPENDITURES, AVERAGE ANNUAL PERCENT GROWTH FROM PRIOR YEAR, 1993-2017
(1) Average annual growth from 1970 through 1993; marks the beginning of the shift to managed care.
(2) Projected.
Source: Centers for Medicare and Medicaid Services, Office of the Actuary.
U.S. INDIVIDUAL LIFE MARKET SHARE BY DISTRIBUTION CHANNEL, 1999-2007
(Based on first year collected premium)
(1) Includes career, multiline exclusive and home service agents.
(2) Includes brokers and personal producing general agents.
(3) Includes stockbrokers, financial institution, worksite and other channels.
(4) Estimate.
Source: LIMRA’s U.S. Individual Life Insurance Sales Studies, LIMRA estimates.
INVESTMENTS, LIFE/HEALTH INSURERS, BOND PORTFOLIO, 2003 AND 2007
Source: National Association of Insurance Commissioners (NAIC) Annual Statement Database, via Highline Data, LLC. Copyrighted information. No portion of this work may be copied or redistributed without the express written permission of Highline Data, LLC.
SALES OF INDIVIDUAL ANNUITIES BY DISTRIBUTION CHANNELS, 2003 AND 2007 (1)
(1) Preliminary.
Source: LIMRA International.
WHERE THE UNDERWRITING DOLLAR GOES, PROPERTY/CASUALTY INSURANCE, ALL LINES, 2007
Source: National Association of Insurance Commissioners (NAIC) Annual Statement Database, via Highline Data, LLC. Copyrighted information. No portion of this work may be copied or redistributed without the express written permission of Highline Data, LLC.
PERCENT CHANGE FROM PRIOR YEAR, NET PREMIUMS WRITTEN, P/C INSURANCE, 1975-2007 (1)
(1) Excludes state funds.
Source: ISO.
OPERATING RESULTS, PROPERTY/CASUALTY INSURANCE, 1998-2007 (1)
($ billions)
(1) Excludes state funds.
(2) Net underwriting gain/loss plus net investment income.
Source: National Association of Insurance Commissioners (NAIC) Annual Statement Database, via Highline Data, LLC. Copyrighted information. No portion of this work may be copied or redistributed without the express written permission of Highline Data, LLC.
PERCENT CHANGE FROM PRIOR YEAR, NET PREMIUMS WRITTEN AND POLICYHOLDERS' SURPLUS, P/C INSURANCE, 1999-2007 (1)
(1) After reinsurance transactions, excluding state funds.
Source: National Association of Insurance Commissioners (NAIC) Annual Statement Database, via Highline Data, LLC. Copyrighted information. No portion of this work may be copied or redistributed without the express written permission of Highline Data, LLC.
PROPERTY/CASUALTY INSURANCE COMBINED RATIO, 1975-2007 (1)
(1) Excluding state funds and residual markets.
Source: ISO.
(1) Cash and invested assets, as of December 31, 2007.
(2) Long-term bonds with maturity dates over one year.
Source: National Association of Insurance Commissioners (NAIC) Annual Statement Database, via Highline Data, LLC. Copyrighted information. No portion of this work may be copied or redistributed without the express written permission of Highline Data, LLC.
TOTAL GROSS SURPLUS LINES PREMIUMS WRITTEN, 2003-2007
($ billions)
Source: 2005 to 2007 premiums from Business Insurance, September 8, 2008; earlier premiums from other issues.
MARKET SHARE TRENDS BY SIZE OF INSURER, 1987-2007 (1)
(1) Based on net premiums written, excluding state funds.
Source: ISO.
($ billions)
(1) After reinsurance transactions, excluding state funds.
(2) Before reinsurance transactions, excluding state funds. May not match total premiums shown elsewhere in this book because of the use of different exhibits from Highline Data LLC.
(3) Includes international and miscellaneous coverages.
(4) Premiums from certain insurers that write health insurance but file financial statements with state regulators on a property/casualty basis.
(5) Only includes nonproportional reinsurance, an arrangement in which a reinsurer makes payments to an insurer whose losses exceed a predetermined amount.
(6) Coverages protecting against legal liability resulting from negligence, carelessness, or failure to act.
Source: National Association of Insurance Commissioners (NAIC) Annual Statement Database, via Highline Data, LLC. Copyrighted information. No portion of this work may be copied or redistributed without the express written permission of Highline Data, LLC.
Source: National Association of Insurance Commissioners (NAIC) Annual Statement Database, via Highline Data, LLC. Copyrighted information. No portion of this work may be copied or redistributed without the express written permission of Highline Data, LLC.
WORKERS COMPENSATION MEDICAL COSTS, 1998-2007
(1) Based on states where the National Council on Compensation Insurance provides ratemaking services. Represents costs for injuries that resulted in time off from work. Data for 2007 is preliminary.
Source: U.S. Bureau of Labor Statistics; National Council on Compensation Insurance.
(2007 $ billions)
(1) Catastrophes are all events causing direct insured losses to property of $25 million or more in 2007 dollars. Adjusted for inflation by ISO.
(2) Includes hurricanes and tropical storms.
(3) Excludes snow.
(4) Includes other geologic events such as volcanic eruptions and other earth movement.
(5) Does not include flood damage covered by the federally administered National Flood Insurance Program.
(6) Includes wildland fires.
Source: ISO's Property Claim Services unit (PCS).
NUMBER OF TORNADOES AND RELATED DEATHS PER MONTH, 2007
Source: U.S. Department of Commerce, Storm Prediction Center, National Weather Service.
(1) Reported to local fire departments.
Source: National Fire Protection Association.
LIGHTNING INCIDENTS BY MONTH, 2002-2005 (1)
(1) Reported to local fire departments.
Source: National Fire Protection Association.
MOTOR VEHICLE DEATHS BY ACTIVITY OF PERSON KILLED, 2007
(1) Includes other nonoccupants.
Source: U.S. Department of Transportation, National Highway Traffic Safety Administration.
MOTOR VEHICLE DEATHS PER 100,000 PERSONS BY AGE, 2007
Source: Insurance Institute for Highway Safety.
INSURANCE EXPENDITURES AS A PERCENTAGE OF TOTAL HOUSEHOLD SPENDING, 2007
Source: U.S. Department of Labor, Bureau of Labor Statistics.
(Percent)
(1) Loss experience in the past 5 years.
Source: 2007 Limits of Liability Report, © Marsh Inc. 2007.
U.S. AVERAGE EXCESS LIABILITY LIMITS RELATIVE TO LOSS EXPERIENCE, 2003-2007
(Average limits purchased, $ millions)
(1) Loss experience in the past 5 years.
Source: 2007 Limits of Liability Report, © Marsh Inc. 2007.
DIRECTORS AND OFFICERS LIABILITY CLAIMS BY TYPE OF CLAIMANT IN THE UNITED STATES, 1997-2007
NA=Not applicable.
Source: 2007 Directors and Officers Liability Survey, Tillinghast-Towers Perrin.
MEDIAN (1) AND AVERAGE PERSONAL INJURY JURY AWARDS, 2000 AND 2006 ($000)
(1) Represents the midpoint jury award. Half of awards are above the median and half are below.
Source: Reprinted with permission from Current Award Trends in Personal Injury. Copyright 2008 by LRP Publications, 747 Dresher Road, P.O. Box 980, Horsham, PA 19044-0980. All rights reserved.
($ billions, excludes state funds)
(1) Includes deposit-type funds beginning in 2001.
Source: National Association of Insurance Commissioners (NAIC) Annual Statement Database, via Highline Data, LLC. Copyrighted information. No portion of this work may be copied or redistributed without the express written permission of Highline Data, LLC.
ASSETS OF FINANCIAL SERVICES SECTORS, 2007; & FINANCIAL SERVICES EMPLOYMENT BY INDUSTRY, 2007
ASSETS OF FINANCIAL SERVICES SECTORS 2003, 2007
($ billions)
NUMBER OF ANNOUNCED FINANCIAL SERVICES MERGERS AND ACQUISITIONS, 2003-2007
Source: SNL Financial LC.
(000)
Source: U.S. Department of Labor, Bureau of Labor Statistics.
GROSS DOMESTIC PRODUCT OF FINANCIAL SERVICES, SHARES BY COMPONENT, INCLUDING REAL ESTATE, 2006
Source: U.S. Department of Commerce, Bureau of Economic Analysis.
GROSS DOMESTIC PRODUCT OF FINANCIAL SERVICES, SHARES BY COMPONENT, EXCLUDING REAL ESTATE, 2006
Source: U.S. Department of Commerce, Bureau of Economic Analysis.
GROSS NATIONAL SAVINGS, 1940-2007 ($ billions)
(1) Includes individuals (including proprietors and partnerships), nonprofit institutions primarily serving individuals, life insurance carriers and miscellaneous entities.
Source: U.S. Department of Commerce, Bureau of Economic Analysis.
HOLDINGS OF U.S. CORPORATE EQUITIES, 2007 (1)
(1) Market value, end of year; excludes open-end mutual fund shares.
(2) Holdings of U.S. issues by foreign residents.
Source: Board of Governors of the Federal Reserve System, June 5, 2008.
(Percent of all U.S. households)
Source: Investment Company Institute; U.S. Department of Commerce, Bureau of the Census.
NUMBER OF AND DOLLARS INVESTED IN 529 PLAN ACCOUNTS, 2003-2007
Source: National Association of State Treasurers.
IDENTITY THEFT AND FRAUD COMPLAINTS, 2005-2007 (1)
(1) Percentages are based on the total number of identity theft and fraud complaints by calendar year. These figures exclude national "Do Not Call" registry complaints.
Source: Federal Trade Commission.
($ trillions, end of year)
(1) Data for 2003, 2005, 2006 and 2007 are estimates.
Source: Investment Company Institute.
RETIREMENT FUNDS ASSET MIX, 2007
Source: Securities Industry and Financial Markets Association.
(000)
(1) Deferred status refers to individuals eligible for future payments.
(2) Payees are retired participants or their beneficiaries receiving payments.
Source: Pension Benefit Guaranty Corporation.
IRA MARKET SHARES BY HOLDER, 2003 AND 2007
Source: Board of Governors of the Federal Reserve System, June 5, 2008.
Source: Based on data from Investment Company Institute: Holden, Sarah, James Duvall, and Elena Barone Chism. 2021. “The Economics of Providing 401(k) Plans: Services, Fees, and Expenses, 2020.” ICI Research Perspective 27, no. 6 (June). Available at www.ici.org/files/2021/ per27-06.pdf.
SALES OF INDIVIDUAL ANNUITIES BY DISTRIBUTION CHANNELS, 2003 AND 2007 (1)
(1) Preliminary.
Source: LIMRA International.
VARIABLE ANNUITY TOTAL SALES BY DISTRIBUTION CHANNEL, 2007 (1)
(1) As of December 31, 2007.
(2) Regulated by the Financial Industry Regulatory Authority.
Source: Morningstar, Inc.
($ billions)
Source: Morningstar, Inc.
MUTUAL FUND RETIREMENT ASSETS BY TYPE OF PLAN, 2007 (1)
($ billions)
(1) Preliminary.
Source: Investment Company Institute.
($ billions)
(1) Estimated.
Source: Bank Insurance and Securities Research Associates (BISRA).
BANK INDIVIDUAL LIFE INSURANCE SALES, 2003-2007
($ millions)
Source: Kehrer-LIMRA.
(1) Based on the responses of banks in the survey that sell insurance products.
Source: 2010 Survey of Banks in Insurance, American Bankers Insurance Association.
(1) Percent of surveyed banks distributing these insurance products.
Source: 2010 Survey of Banks in Insurance, American Bankers Insurance Association.
PREMIUMS BY TYPE OF INSURER, 2007 (1)
(1) Gross direct premiums. Total premiums for 2007 were $1,580 billion.
(2) Blue Cross/Blue Shield, HMOs and hospital, medical and dental indemnity.
Source: National Association of Insurance Commissioners (NAIC). Reprinted with permission. Further reprint or distribution strictly prohibited without written permission of NAIC.
U.S. PROPERTY/CASUALTY AND LIFE/HEALTH INSURANCE PREMIUMS, 2007 (1)
(1) Excluding state funds.
Source: National Association of Insurance Commissioners (NAIC) Annual Statement Database, via Highline Data, LLC. Copyrighted information. No portion of this work may be copied or redistributed without the express written permission of Highline Data, LLC.
TYPES OF BONDS INSURED BY FINANCIAL GUARANTY INSURERS, 2007 (1)
(1) Net par outstanding, December 31, 2007.
Source: Association of Financial Guaranty Insurers.
WORKSITE LIFE INSURANCE COMPANY SALES BY LINE OF BUSINESS, 2007 (1)
(1) Short-term and long-term disability.
Source: East Bridge Consultants.
THE NATION'S HEALTHCARE DOLLAR: 2006 WHERE IT COMES FROM (1)
(1) Does not add to 100 percent due to rounding.
(2) State Children’s Health Insurance Program.
Source: Centers for Medicare and Medicaid Services, Office of the Actuary.
ASSETS OF FDIC-INSURED COMMERCIAL BANKS, 2007
Source: Federal Deposit Insurance Corporation.
CREDIT UNION MEMBERS, 1980-2007
(000)
Source: National Credit Union Administration.
(Percent)
(1) New York Stock Exchange members doing public business.
Source: Securities Industry and Financial Markets Association.
($ billions)
(1) New York Stock Exchange members doing public business.
Source: Securities Industry and Financial Markets Association.
(Percent)
(1) New York Stock Exchange member firms doing public business.
Source: Securities Industry and Financial Markets Association.
ASSET-BACKED SECURITY SOURCES, 2003 AND 2007
(1) Securities of federal mortgage pools backing privately issued collateralized mortgage obligations (CMOs). In CMOs, mortgage principal and interest payments are separated into different payment streams to create bonds that repay capital over differing periods of time.
(2) Mortgages backing privately issued pool securities and CMOs.
(3) Treasury securities accounted for less than 1 percent in 2003.
Source: Board of Governors of the Federal Reserve System, June 5, 2008.
MUTUAL FUND INDUSTRY NET ASSETS BY TYPE OF FUND, 2007; & NUMBER OF MUTUAL FUNDS BY TYPE OF FUND, 2007
Source: Investment Company Institute.
(1) Based on states where the National Council on Compensation Insurance provides ratemaking services. Represents costs for injuries that resulted in time off from work. Data for 2009 are preliminary.
Source: U.S. Bureau of Labor Statistics; National Council on Compensation Insurance.
(1) Represents the midpoint jury award. Half of awards are above the median and half are below.
Source: Thomson Reuters.
Source: National Association of State Treasurers.
Source: Thomson Reuters.
Source: Federal Deposit Insurance Corporation.
($ billions)
(1) As of December 9.
Source: GC Securities and Guy Carpenter & Company, LLC.
(Percent change from prior year)
Source: Board of Governors of the Federal Reserve System, June 10, 2010.
($ billions)
(1) As of December 9.
Source: GC Securities and Guy Carpenter & Company, LLC.
($ billions, end of year)
Source: Board of Governors of the Federal Reserve System, June 10, 2010.
($ trillions, year-end)
(1) Estimated.
Source: Investment Company Institute.
(1) Market value, end of year; excludes open-end mutual fund shares.
(2) Holdings of U.S. issues by foreign residents.
Source: Board of Governors of the Federal Reserve System, June 10, 2010.
(1) Percentages are dollar-weighted averages.
Source: Investment Company Institute.
Source: Board of Governors of the Federal Reserve System, June 10, 2010.
($ billions, end of year)
(1) Preliminary data. Does not include defined benefit plans.
Source: Investment Company Institute.
(1) Securities of federal mortgage pools backing privately issued collateralized mortgage obligations (CMOs). In CMOs, mortgage principal and interest payments are separated into different payment streams to create bonds that repay capital over differing periods of time.
(2) Mortgages backing privately issued pool securities and CMOs.
(3) Treasury securities accounted for less than 1 percent in 2005.
Source: Board of Governors of the Federal Reserve System, June 10, 2010.
($ billions, end of year)
(1) Includes Keoghs and other defined contribution plans, such as profit-sharing plans, without 401(k) features.
(2) Estimated.
Note: May not add to total due to rounding.
Source: Investment Company Institute.
(Percent, end of year)
Source: Federal Deposit Insurance Corporation.
(1) Includes savings banks and commercial banks; includes Keogh accounts.
(2) Includes Keogh accounts.
(3) Excludes variable annuities.
Source: Board of Governors of the Federal Reserve System, June 7, 2012.
Source: Board of Governors of the Federal Reserve System, June 10, 2010.
($ billions)
Source: Board of Governors of the Federal Reserve System.
($ billions, net premiums written)
Source: SNL Financial LC.
Source: SNL Financial LC.
(Percent change from prior year)
(1) Net premiums written, excluding state funds.
(2) Premiums and annuity considerations (fees for annuity contracts) for life/health insurance companies. Includes deposit-type funds beginning in 2001.
Source: SNL Financial LC.
($ billions)
(1) After reinsurance transactions, excluding state funds.
(2) Before reinsurance transactions; includes some state funds.
(3) Includes international and miscellaneous coverages.
(4) Premiums from certain insurers that write health insurance but file financial statements with state regulators on a property/casualty rather than life/health basis.
(5) Only includes nonproportional reinsurance, an arrangement in which a reinsurer makes payments to an insurer whose losses exceed a predetermined amount.
(6) Coverages protecting against legal liability resulting from negligence, carelessness, or failure to act.
Source: SNL Financial LC.
(£ millions)
(1) Values are in British pounds. 1998 breakdown is International Financial Services, London's estimate based on 1997 and 1999 data.
Source: Association of British Insurers; International Underwriting Association of London; Lloyd's; Carter and Falush: The London Insurance Market.
(1) Net premiums written, excluding state funds.
Source: SNL Financial LC.
(£ billions)
(1) Beginning of year.
Source: Lloyd's Members' Services Unit
Source: Swiss Re, sigma, No. 2/2010, update December 2010.
($ billions)
Source: Board of Governors of the Federal Reserve System, June 5, 2008.
($ billions)
(1) Includes individuals (including proprietors and partnerships), nonprofit institutions primarily serving individuals, life insurance carriers and miscellaneous entities.
Source: U.S. Department of Commerce, Bureau of Economic Analysis.
(1) Property/casualty: net premiums written, excluding state funds; life/health: premiums, annuity considerations (fees for annuity contracts) and deposit-type funds.
Source: SNL Financial LC.
($000)
(1) Indemnity costs per lost-time claim. 1991-2006: Based on data through 12/31/2006, developed to ultimate; based on the states where NCCI provides ratemaking services. Excludes the effects of deductible policies.
(2) Preliminary based on data valued as of 12/31/2007.
Source: NCCI Holdings, Inc.
(Percent of all U.S. households)
Source: Investment Company Institute, U.S. Bureau of the Census.
(Percent change from prior year)
(1) Net premiums written, excluding state funds.
(2) Premiums and annuity considerations (fees for annuity contracts) for life/health insurance companies.
Source: SNL Financial LC.
Source: Sallie Mae.
Source: © 2011 Munich Re, Geo Risks Research, NatCatSERVICE. As of April 2011.
(1) Long-term bonds with maturity dates over one year, as of December 31, 2011.
Source: SNL Financial LC.
†Overall agricultural crop losses were approximately $20 billion. $15-17 billion was recovered by the public-private multi-peril crop insurance program, making it the biggest loss in U.S. agricultural insurance history. In average years insured losses were around $9 billion.
Source: © 2013 Munich Re, NatCatSERVICE. As of January 2013.
(1) Cash and invested net admitted assets, as of December 31, 2011.
Source: SNL Financial LC.
(Number of events)
Source: © 2016 Munich Re, NatCatSERVICE. As of July 2016.
(1) Excluding state funds and residual markets.
Source: ISO, a Verisk Analytics company.
(Number of events, Annual totals 1980–2010 vs. first six months 2011)
Source: © 2011 Munich Re. NatCatSERVICE.
(1) Excludes state funds.
Source: ISO, a Verisk Analytics company.
(January – June Only, 1980 - 2012)
Source: 2012 Munich Re, NatCatSERVICE; The Property Claim Services (PCS) unit of ISO. As of July 2012.
(2011 $ billions)
(1) Estimated property losses adjusted for inflation through 2011 by ISO using the GDP implicit price deflator. Excludes catastrophes causing direct losses less than $25 million in 1997 dollars. Does not include flood damage covered by the federally administered National Flood Insurance Program.
(2) Excludes snow.
(3) Includes wildland fires.
(4) Includes losses from civil disorders, water damage, utility service disruptions, and any workers compensation catastrophes generating losses in excess of PCS's threshold after adjusting for inflation.
Source: The Property Claim Services (PCS) unit of ISO, a Verisk Analytics company.
(2015 $ billions)
Source: © 2016 Munich Re, NatCatSERVICE; Property Claim Services (PCS®)*, a Verisk Analytics® business. As of January 2016.
(Based on perils; US$ millions)
Source: © 2020 Munich Re, NatCatSERVICE; Property Claim Services (PCS®)*, a Verisk Analytics® business. As of June 2020.
(2019 $ billions)
Source: © 2020 Munich Re, Geo Risks Research, NatCatSERVICE. As of June 2020.
(2011 $ billions)
(1) Estimated property losses adjusted for inflation through 2011 by ISO using the GDP implicit price deflator. Excludes catastrophes causing direct losses less than $25 million in 1997 dollars. Does not include flood damage covered by the federally administered National Flood Insurance Program. Percentages do not sum to 100 due to rounding.
(2) Includes the other 47 states plus Washington, D.C., Puerto Rico, and the U.S. Virgin Islands.
Source: The Property Claim Services (PCS) unit of ISO, a Verisk Analytics company.
(1) Preliminary.
Source: LIMRA International.
(Based on first year collected premium)
(1) Includes brokers, stockbrokers and personal producing general agents.
(2) Includes career, multiline exclusive and home service agents.
(3) No producers are involved. Does not include direct marketing efforts involving agents.
(4) Includes financial institutions, worksite and other channels.
(5) Estimate.
Source: LIMRA’s U.S. Individual Life Insurance Sales Survey and LIMRA estimates.
($ billions, year-end)
Source: LIMRA International, The U.S. Individual Annuity Yearbook - 2009.
(1) Based on complaints submitted to the Internet Crime Complaint Center.
Source: Internet Crime Complaint Center.
Source: Insurance Research Council: Public Attitude Monitor, 2003.
($ billions)
Source: LIMRA International, The U.S. Individual Annuity Yearbook - 2009.
(1) Percentages are based on the total number of Consumer Sentinel Network complaints by calendar year. These figures exclude "Do Not Call" registry complaints.
Source: Federal Trade Commission.
(1) Excludes AIDS/HIV.
Source: JHA, Inc., 2004 Disability Rate Study & Risk Management Survey.
($ billions)
(1) Estimated.
Source: Kehrer-LIMRA.
Source: Federal Emergency Management Agency (FEMA).
($ millions)
Source: GC Securities and Guy Carpenter & Company, LLC.
Source: Federal Emergency Management Agency (FEMA).
(1) The symbols show the most affected regions. The map shows events with property losses and/or fatalities.
Source: © 2010 Münchener Rückversicherungs-Gesellschaft, Geo Risks Research, NatCatSERVICE – As of December 2010.
(1) Preliminary.
Source: LIMRA International.
(1) As reported by participating carriers. Duration from disability date, includes Elimination Period, for closed claims only.
(2) Excludes AIDS/HIV.
Source: JHA, Inc., 2004 Disability Rate Study & Risk Management Survey.![]()
(1) Excludes state funds.
Source: ISO.
(1) Average annual growth from 1970 through 1993; marks the beginning of the shift to managed care.
(2) Projected.
Source: Centers for Medicare and Medicaid Services, Office of the Actuary.
(1) Excluding state funds and residual markets.
Source: ISO.
($ billions)
(1) Single premium contracts bought by property/casualty insurers to distribute awards in personal injury or wrongful death lawsuits over a period of time, rather than as lump sums.
Source: LIMRA International.
($ millions)
(1) Based on total new premium.
Source: Kehrer-LIMRA.
($ billions)
(1) Excludes state funds.
(2) Net underwriting gain/loss plus net investment income.
Source: SNL Financial LC.
($ millions)
(1) Sales are gross premiums written.
Source: Organization for Economic Cooperation and Development.
(1) After reinsurance transactions, excluding state funds.
Source: SNL Financial LC.
(1) Based on states where the National Council on Compensation Insurance provides ratemaking services. Represents costs for injuries that resulted in time off from work. Data for 2011 are preliminary.
Source: U.S. Department of Commerce, Bureau of Labor Statistics; National Council on Compensation Insurance.
Source: U.S. Department of Labor, Bureau of Labor Statistics.
(1) Short-term and long-term disability.
Source: Eastbridge Consulting Group, Inc.
($ billions)
(1) Single premium contracts bought by property/casualty insurers to distribute awards in personal injury or wrongful death lawsuits over a period of time, rather than as lump sums.
Source: LIMRA International.
(1) Average annual growth from 1970 through 1993; marks the beginning of the shift to managed care.
(2) Projected.
Source: Centers for Medicare and Medicaid Services, Office of the Actuary, National Health Statistics Group.
(1) Includes co-payments, deductibles, and any amounts not covered by health insurance.
(2) Department of Veterans Affairs, Department of Defense and Children's Health Insurance Program.
Source: Centers for Medicare and Medicaid Services, Office of the Actuary, National Health Statistics Group.
Source: SNL Financial LC.
($ billions)
Source: The Property Claim Service (PCS) unit of ISO, a Verisk Analytics company. As of 7/23/13.
(Based on first year collected premium)
(1) Includes career, multiline exclusive and home service agents.
(2) Includes brokers and personal producing general agents.
(3) No producers are involved. Does not include direct marketing efforts involving agents.
(4) Includes stockbrokers, financial institutions, worksite and other channels.
(5) Estimate.
Source: LIMRA’s Market Share by Distribution Channel Survey, LIMRA estimates.
Source: The Property Claim Service (PCS) unit of ISO, a Verisk Analytics company. As of 7/23/13.
Source: U.S. Department of Commerce, Storm Prediction Center, National Weather Service.
Source: SNL Financial LC.
(1) Based on plaintiff and defendant verdicts rendered.
Source: Thomson Reuters.
(1) Cash and invested net admitted assets, as of December 31, 2009.
(2) Long-term bonds with maturity dates over one year.
Source: SNL Financial LC.
(1) Includes private insurance and FAIR plans.
Source: ISO, a Verisk Analytics company.
(Percent change from prior year)
(1) Percent change using seasonally adjusted data from prior year on an end-of-year basis.
Source: Board of Governors of the Federal Reserve System, June 7, 2012.
(1) Based on net premiums written, excludes state funds and other residual market carriers.
Source: ISO, a Verisk Analytics company.
($ billions, end of year)
Source: Board of Governors of the Federal Reserve System, June 7, 2012.
($ billions)
(1) After reinsurance transactions, excluding state funds.
(2) Before reinsurance transactions.
(3) Includes international and miscellaneous coverages.
(4) Premiums from certain insurers that write health insurance but file financial statements with state regulators on a property/casualty rather than life/health basis.
(5) Only includes nonproportional reinsurance, an arrangement in which a reinsurer makes payments to an insurer whose losses exceed a predetermined amount.
(6) Coverages protecting against legal liability resulting from negligence, carelessness, or failure to act.
Source: SNL Financial LC.
($ billions)
Source: 2009 to 2011 premiums from Business Insurance, October 8, 2012; earlier premiums from other issues.
($ billions, end of year)
(1) Preliminary data. Excludes defined benefit plans.
Source: Investment Company Institute. 2021. 2021 Investment Company Fact Book: A Review of Trends and Activities in the U.S. Investment Company Industry. Washington, D.C. Investment Company Institute. www.icifactbook.org.
(1) Short-term and long-term disability.
Source: Eastbridge Consulting Group, Inc.
Source: Board of Governors of the Federal Reserve System, June 7, 2012.
($ billions)
Source: Board of Governors of the Federal Reserve System.
Source: © 2013 Munich Re, Geo Risks Research, NatCatSERVICE. As of January 2013.
(1) Mortgages backing privately issued pool securities and collateralized mortgage obligations (CMOs).
(2) Securities of federal mortgage pools backing privately issued CMOs. In CMOs, mortgage principal and interest payments are separated into different payment streams to create bonds that repay capital over differing periods of time.
Source: Board of Governors of the Federal Reserve System, June 7, 2012.
(2009 $ billions)
(1) Catastrophes are all events causing direct insured losses to property of $25 million or more in 2009 dollars. Adjusted for inflation by ISO.
(2) Excludes snow.
(3) Does not include flood damage covered by the federally administered National Flood Insurance Program.
(4) Includes wildland fires.
(5) Includes civil disorders, water damage, utility service disruptions and non-property losses such as those covered by workers compensation.
Source: ISO's Property Claim Services (PCS) unit.
(Number of events)
Source: © 2013 Munich Re, Geo Risks Research, NatCatSERVICE. As of January 2013.
Source: Investment Company Institute.
(1) Includes Fannie Mae and Freddie Mac. GSEs are government-sponsored enterprises.
Source: Federal Housing Finance Agency.
(Overall and insured losses)
Source: © 2013 Munich Re, Geo Risks Research, NatCatSERVICE. As of January 2013.
($ millions)
* Data based on information from PCS.
Source: © 2016 Munich Re, Geo Risks Research, NatCatSERVICE. As of January 2016.
(Market value, end of year)
(1) Excludes variable annuities.
(2) Includes Keogh accounts.
(3) Includes savings banks, commercial banks and Keogh accounts.
Source: Board of Governors of the Federal Reserve System, June 10, 2021.
(1) HECMs are federally insured reverse mortgage products.
(2) Through July 2010; fiscal year ends September 30.
Source: National Reverse Mortgage Lenders Association.
Source: © 2013 Munich Re, NatCatSERVICE. As of July 2013.
Source: U.S. Department of Commerce, Bureau of Economic Analysis.
(Percent)
Source: U.S. Department of Commerce, Census Bureau; Housing Vacancy Survey.
(Overall and insured losses)
Source: © 2013 Munich Re, NatCatSERVICE; The Property Claim Services (PCS) unit of ISO. As of January 2013.
Source: U.S. Department of Commerce, Bureau of Economic Analysis.
(1) Estimated.
Source: American Bankers Association.
(Number of events)
Source: © 2013 Munich Re, NatCatSERVICE. As of January 2013.
($ billions)
Source: Board of Governors of the Federal Reserve System.
(1) As of July 31, 2018.
Source: Federal Emergency Management Agency (FEMA).
(Annual totals 1980–2012)
Source: 2013 Munich Re, NatCatSERVICE; The Property Claim Services (PCS) unit of ISO. As of January 2013.
(000)
Source: U.S. Department of Labor, Bureau of Labor Statistics.
(1) Average annual growth from 1970 through 1993; marks the beginning of the shift to managed care.
(2) Projected.
Source: Centers for Medicare and Medicaid Services, Office of the Actuary.
Source: © 2013 Munich Re, NatCatSERVICE; NOAA. As of January 2013.
(1) Market value, end of year; excludes open-end mutual fund shares.
(2) Holdings of U.S. issues by foreign residents.
Source: Board of Governors of the Federal Reserve System, June 7, 2012.
($ billions)
(1) Excludes state funds.
(2) Net underwriting gain/loss plus net investment income.
Source: SNL Financial LC.
Source: 2013 Munich Re, NatCatSERVICE; The Property Claim Services (PCS) unit of ISO; National Flood Insurance Plan. As of January 2013.
Source: U.S. Individual Annuities, GLIMPSE Quarterly Reports, LIMRA Secure Retirement Institute.
($ billions)
(1) Projected.
Source: Celent.
($ billions, 2013 dollars)
(1) $1 billion economic loss and/or 50 fatalities, as of January 7, 2014. Losses based on property losses including, if applicable, agricultural, offshore, marine, aviation and National Flood Insurance Program losses and may differ from data shown elsewhere.
Source: © 2014 Munich Re. NatCatSERVICE.
($ billions)
(1) Single premium contracts bought by property/casualty insurers to distribute awards in personal injury or wrongful death lawsuits over a period of time, rather than as lump sums. Classified as a fixed annuity.
Source: LIMRA International.
(1) After reinsurance transactions, excluding state funds.
Source: SNL Financial LC.
Note: U.S. insured losses for Hurricane Irene includes National Flood Insurance Program (NFIP) claims. The U.S. insured loss for Tropical storm Lee does not include NFIP losses.
Source: © 2011 Münchener Rückversicherungs-Gesellschaft, Geo Risks Research, NatCatSERVICE. As of November 2011.
($ millions)
(1) Based on total new premiums.
Source: Bank Insurance and Securities Research Associates (BISRA).
($ Billions) (Stated in 2006 Dollars)
Source: National Weather Service.
(1) Based on a survey of insurance departments by the NAIC. May vary somewhat from data based on annual statement filings.
(2) Blue Cross/Blue Shield, HMOs and hospital, medical and dental indemnity.
Source: National Association of Insurance Commissioners (NAIC). Reprinted with permission. Further reprint or redistribution strictly prohibited without written permission of NAIC.
(1) Reported to local fire departments.
Source: National Fire Protection Association.
Source: 1900-1950: U.S. Department of Commerce, Census Bureau, Census of Housing. 1960-present: Census Bureau, Housing Vacancy Survey.
Source: SNL Financial LC.
Source: © 2016 Munich Re, Geo Risks Research, NatCatSERVICE. As of January 2016.
(1) Data prior to 2009 not strictly comparable to earlier data.
Source: National Association of State Treasurers.
($ billions)
Source: Organization for Economic Cooperation and Development.
($ millions)
*U.S. losses from Property Claim Services.
Source: © 2016 Munich Re, Geo Risks Research, NatCatSERVICE. As of January 2016.
(1) Includes finance company subsidiaries of bank holding companies but not of retailers and banks. Includes owned receivables (carried on the balance sheet of the institution) and managed receivables (outstanding balances of pools upon which securities have been issued; these balances are no longer carried on the balance sheets of the loan originator).
Source: Board of Governors of the Federal Reserve System.
(US$ billions)
Source: Organization for Economic Cooperation and Development.
Source: © 2016 Munich Re, Geo Risks Research, NatCatSERVICE. As of January 2016.
(US$ billions)
(1) Before reinsurance transactions.
(2) Includes accident and health insurance.
Source: Swiss Re Institute, sigma, 2/2025.
(1) Includes co-payments, deductibles, and any amounts not covered by health insurance.
(2) Department of Veterans Affairs, Department of Defense and Children's Health Insurance Program.
Source: Centers for Medicare and Medicaid Services, Office of the Actuary, National Health Statistics Group.
($ billions, net premiums written)
Source: SNL Financial LC.
Source: National Fire Protection Association.
Source: SNL Financial LC.
($ billions)
Source: GC Securities, a division of MMC Securities Corp., a U.S. registered broker-dealer, member FINRA/SIPC and Guy Carpenter.
(1) Cash and invested net admitted assets, as of December 31, 2024.
(2) Bonds represents 54.7% of total investments.
(3) Includes mortgage loans on real estate.
Source: NAIC data, sourced from S&P Global Market Intelligence, Insurance Information Institute.
($ billions)
Source: GC Securities, a division of MMC Securities Corp., a U.S. registered broker-dealer, member FINRA/SIPC and Guy Carpenter.
Source: © 2013 Munich Re. NatCatSERVICE; National Interagency Fire Center. As of January 2013.
(Percent)
(1) Loss experience in the past 5 years.
Source: 2008 Limits of Liability Report, © Marsh Inc. 2008.
(Five costliest events ordered by overall losses)
Source: © 2016 Munich Re, NatCatSERVICE; Property Claim Services (PCS®)*, a Verisk Analytics® business. As of February 2016.
(Average limits purchased, $ millions)
(1) Loss experience in the past 5 years.
Source: 2008 Limits of Liability Report, © Marsh Inc, 2008.
($ billions)
(1) Includes individuals (including proprietors and partnerships), nonprofit institutions primarily serving individuals, life insurance carriers and miscellaneous entities.
Source: U.S. Department of Commerce, Bureau of Economic Analysis.
(1) Includes deaths resulting from conflagration, regardless of nature of injury.
(2) Inhalation and ingestion of food or other object that obstructs breathing.
Source: National Safety Council.
Source: Jury Verdict Research.
(1) Percentages are based on the total number of Consumer Sentinel Network reports by calendar year. These figures exclude "Do Not Call" registry complaints.
Source: Federal Trade Commission, Consumer Sentinel Network.
($000)
(1) Represents the midpoint jury award. Half of awards are above the median and half are below.
Source: Reprinted with permission from Current Award Trends in Personal Injury. Copyright 2010 by LRP Publications, 747 Dresher Road, P.O. Box 980, Horsham, PA 19044-0980. All rights reserved.
($ trillions, end of year)
(1) Data for 2003, 2009, 2010 and 2011 are estimates.
Source: Investment Company Institute.
Source: Reprinted with permission of Thomson Reuters, Current Award Trends in Personal Injury, 54th edition.
Source: U.S. Department of Labor, Bureau of Labor Statistics.
(US$ billions)
(1) Property/casualty: net premiums written after reinsurance transactions, excludes state funds; life/annuity: premiums, annuity considerations (fees for annuity contracts) and deposit-type funds. Both sectors include accident and health insurance.
Source: NAIC data, sourced from S&P Global Market Intelligence: Insurance Expense Exhibits, Summary of Operations; Insurance Information Institute.
($ billions)
Source: 2007 to 2009 premiums from Business Insurance, October 11, 2010; earlier premiums from other issues.
($ billions)
(1) After reinsurance transactions, excludes state funds.
(2) Before reinsurance transactions, includes some state funds.
(3) Includes miscellaneous coverages.
(4) Includes federally sponsored multiple peril crop and private market crop-hail.
(5) Premiums from certain insurers that write health insurance but file financial statements with state regulators on a property/casualty rather than life/health basis.
(6) Only includes nonproportional reinsurance, an arrangement in which a reinsurer makes payments to an insurer whose losses exceed a predetermined amount.
(7) Coverages protecting against legal liability resulting from negligence, carelessness or failure to act.
Source: NAIC data, sourced from S&P Global Market Intelligence, Insurance Information Institute.
Source: © 2011 Munich Re, Geo Risks Research, NatCatSERVICE. As of July 2011.
($ billions)
Source: NAIC data, sourced from S&P Global Market Intelligence, Insurance Information Institute.
Source: Pew Internet and American Life Project.
(1) Based on net premiums written, excluding state funds.
Source: ISO.
(End of year)
Source: Federal Deposit Insurance Corporation (FDIC).
Source: Securities Industry and Financial Markets Association.
($ billions)
(1) Represents homeowners' cash withdrawals from home mortgage refinance transactions. Includes prime conventional loans only and is net of retirement of outstanding second mortgages.
(2) Estimated.
Source: Freddie Mac.
(000)
Source: Securities Industry and Financial Markets Association.
Source: Securities Industry and Financial Markets Association.
(Percent)
(1) New York Stock Exchange reporting firms doing public business.
Source: Securities Industry and Financial Markets Association.
($ billions)
(1) New York Stock Exchange reporting firms doing public business.
Source: Securities Industry and Financial Markets Association.
($ billions)
Source: Securities Industry and Financial Markets Association.
Source: McKinsey IICF survey, Center for Encouraging Corporate Philanthropy, Giving by Numbers 2010, McKinsey analysis.
Source: SNL Financial LC.
(End of year)
Source: Investment Company Institute.
($ billions)
(1) Estimated.
Source: Celent.
(1) HECMs are federally insured reverse mortgage products.
(2) Through April 2012; fiscal year ends September 30.
Source: National Reverse Mortgage Lenders Association.
Source: Investment Company Institute.
($B, Adjusted to 2008 Price Level)
(1) Estimated September 11 industry loss at 2001 price level is $32.5 billion.
Source: Insurance Information Institute.
(Overall and insured losses, 2015 $billions)
Source: © 2016 Munich Re, NatCatSERVICE; Property Claim Services (PCS®)*, a Verisk Analytics® business. As of July 2016.
(Percent)
(1) New York Stock Exchange reporting firms doing public business in the United States.
Source: NYSE Euronext; Securities Industry and Financial Markets Association.
(1) Based on selected components of underwriting as a percent of net premiums earned, rebased to 100.0 percent.
(2) Taxes, licenses, fees, acquisitions, field supervision, collection and general expenses.
Source: SNL Financial LC.
($ billions)
(1) As of January.
Source: Hennessee Group, LLC.
Source: © 2014 Munich Re, Geo Risks Research, NatCatSERVICE. As of January 2014.
(1) The states of Alabama, Florida, and Minnesota did not provide monthly breakdowns for offense and are not included in the monthly variations.
Source: U.S. Department of Justice, Federal Bureau of Investigation.
(1) Percent of drivers using hand-held cellphones.
Source: U.S. Department of Transportation, National Highway Traffic Safety Administration.
(1) Based on participants in the survey that reported one or more claims over the five-year period.
Source: JLT Specialty 2015 U.S. Directors and Officers Liability Survey.
*Only includes tenants or renters insurance on the contents of a residence.
**Bureau of Labor Statistics’ Producer Price Index (preliminary).
***Median sales price. Data from the National Association of Realtors.
(1) Based on participants in the survey that reported one or more claims over the 10-year period.
Source: 2011 Directors and Officers Liability Survey, Towers Watson.
Source: © 2011 Munich Re, Geo Risks Research, NatCatSERVICE. As of October 2011.
(1) Based on participants in the survey that reported one or more claims over the four-year period.
Source: JLT Specialty 2015 U.S. Directors and Officers Liability Survey.
(Annual totals 1980 – 2011)
Source: © 2012 Munich Re. NatCatSERVICE.
(1) Estimated insured losses are based on property losses including, if applicable, agricultural, offshore, marine, aviation and National Flood Insurance Program losses and may differ from data shown elsewhere. As of July 6, 2011.
(2) Severe thunderstorm includes tornadoes.
(3) Tropical cyclone includes hurricanes.
Source: © 2011 Munich Re. NatCatSERVICE.
(Number of events, January-June only)
Source: © 2011 Munich Re. NatCatSERVICE.
(January – June only, 1980-2011)
Source: © 2011 Munich Re. NatCatSERVICE.
(2016 $ billions)
(1) Adjusted for inflation through 2016 by ISO using the GDP implicit price deflator. Excludes catastrophes causing direct losses less than $25 million in 1997 dollars. Excludes flood damage covered by the federally administered National Flood Insurance Program.
(2) Includes other wind, hail, and/or flood losses associated with catastrophes involving tornadoes.
(3) Includes wildland fires.
(4) Includes losses from civil disorders, water damage, utility service disruptions, and any workers compensation catastrophes generating losses in excess of PCS's threshold after adjusting for inflation.
Source: The Property Claim Services® (PCS®) unit of ISO®, a Verisk Analytics® company.
(Annual totals 1980–2010 vs. first half 2011)
Source: © 2011 Munich Re. NatCatSERVICE.
Source: Board of Governors of the Federal Reserve System, June 10, 2021.
Source: © 2014 Munich Re, NatCatSERVICE; Property Claim Services (PCS®)*, a Verisk Analytics® business; National Flood Insurance Plan. As of January 2014.
(1) Includes co-payments, deductibles, and any amounts not covered by health insurance.
(2) Department of Veterans Affairs, Department of Defense and Children's Health Insurance Program.
Source: Centers for Medicare and Medicaid Services, Office of the Actuary, National Health Statistics Group.
Source: SNL Financial LC.
(1) Includes other non-occupants.
Source: U.S. Department of Transportation, National Highway Traffic Safety Administration.
(000)
(1) Deferred status refers to individuals eligible for future payments.
(2) Payees are retired participants or their beneficiaries receiving payments.
Source: Pension Benefit Guaranty Corporation.
Source: U.S. Department of Commerce, Bureau of Economic Analysis.
($ billions)
(1) Excludes premiums of Lloyd’s of London syndicates.
Source: Business Insurance (www.businessinsurance.com), September 2017.
Source: U.S. Department of Commerce, Bureau of Economic Analysis.
Note: Percentages do not add up to 100 percent due to rounding.
(1) Excludes insurance.
Source: U.S. Department of Labor, Bureau of Labor Statistics.
Source: National Fire Protection Association.
($ billions)
Source: NAIC data, sourced from S&P Global Market Intelligence, Insurance Information Institute.
Source: U.S. Department of Commerce, National Oceanic and Atmospheric Administration, National Weather Service and National Lightning Safety Council.
($ billions)
Source: NAIC data, sourced from S&P Global Market Intelligence, Insurance Information Institute.
Source: NAIC data, sourced from S&P Global Market Intelligence, Insurance Information Institute.
(1) Reported to local fire departments.
Source: National Fire Protection Association.
(000)
Source: U.S. Department of Commerce, Census Bureau.
Source: U.S. Department of Commerce, Storm Prediction Center, National Weather Service.
(1) Percent of all drivers using handheld cellphones.
Source: U.S. Department of Transportation, National Highway Traffic Safety Administration.
($ millions)
(1) Based on total new premium.
Source: Kehrer-LIMRA.
($ U.S. dollars)
($ billions, excludes state funds)
(1) Includes deposit type funds beginning in 2001.
Source: National Association of Insurance Commissioners (NAIC) Annual Statement Database, via Highline Data, LLC. Copyrighted information. No portion of this work may be copied or redistributed without the express written permission of Highline Data, LLC.
($ millions)
Source: GC Securities and Guy Carpenter & Company, LLC.
(Premiums and investments)
($ millions)
Source: GC Securities and Guy Carpenter & Company, LLC.
(Premiums and investments)
(1) Based on participants in the survey that reported one or more claims over the 10-year period.
Source: 2010 Directors and Officers Liability Survey, Towers Watson.
($ 2024 billions)
(1) Adjusted to 2024 dollars by the Insurance Information Institute using the U.S. Department of Labor BLS Calculator.
(2) Loss total does not include March 2010 New York City settlement of up to $657.5 million to compensate approximately 10,000 Ground Zero workers or any subsequent settlements.
Source: Insurance Information Institute.
(1) Based on participants in the survey that reported one or more claims over the 10-year period.
Source: 2010 Directors and Officers Liability Survey, Towers Watson.
(1) Based on data in the National Association of Independent Insurers, 2002 Survey on the Use of Credit Information in Personal Lines Insurance; NAII is one of the predecessor organizations to the Property Casualty Insurers of America.
Source: Property Casualty Insurers Association of America.
Source: Jury Verdict Research.
($ billions)
Source: Board of Governors of the Federal Reserve System, June 7, 2012.
(1) Based on participants in the survey that reported one or more claims over the 10-year period.
Source: 2010 Directors and Officers Liability Survey, Towers Watson.
($000)
(1) 1999-2007: Based on data through 12/31/2007, developed to ultimate; based on the states where NCCI provides ratemaking services, including state funds. Excludes high deductible policies.
(2) Preliminary based on data valued as of 12/31/2008.
Source: NCCI Holdings, Inc.
(000)
Source: U.S. Department of Labor, Bureau of Labor Statistics.
(1) Percentages are dollar weighted averages.
Source: Investment Company Institute.
(000)
(1) Deferred status refers to individuals eligible for future payments.
(2) Payees are retired participants or their beneficiaries receiving payments.
Source: Pension Benefit Guaranty Corporation.
(1) Does not add to total due to rounding.
Source: Investment Company Institute.
(1) State Children's Health Insurance Program.
(2) Includes programs such as workers compensation, public health activity, Department of Defense, Department of Veterans Affairs, Indian Health Service, state and local hospital subsidies and school health.
(3) Includes industrial in-plant, privately funded construction and nonpatient revenues, including philanthropy.
Source: Centers for Medicare and Medicaid Services, Office of the Actuary.
Source: Investment Company Institute.
(Percent of all U.S. households)
Source: Investment Company Institute, U.S. Bureau of the Census.
($ trillions, year-end)
Source: Investment Company Institute.
($ trillions, year-end)
Source: Investment Company Institute.
(1) Average annual growth from 1970 through 1993; 1993 marked the beginning of the shift to managed care.
(2) Projected.
Source: Centers for Medicare and Medicaid Services, Office of the Actuary.
($ trillions, end of year)
(1) Data for 2003, 2005, 2008, 2009 and 2010 are estimates. Data for 2006 and 2007 are preliminary.
Source: Investment Company Institute.
(000)
Source: U.S. Department of Labor, Bureau of Labor Statistics.
(1) Percentages are dollar-weighted averages.
Source: Investment Company Institute.
(000)
Source: U.S. Department of Labor, Bureau of Labor Statistics.
($ billions, end of year)
(1) Includes Keoghs and other defined contribution plans, such as profit-sharing plans, without 401(k) features.
(2) Estimated.
Source: Investment Company Institute.
Source: © 2020 Munich Re, Geo Risks Research, NatCatSERVICE. As of January 2020.
($ billions)
(1) Single premium contracts bought by property/casualty insurers to distribute awards in personal injury or wrongful death lawsuits over a period of time, rather than as lump sums.
Source: LIMRA International.
Source: U.S. Department of Commerce, Storm Prediction Center, National Weather Service.
(1) Percentages are based on the total number of Consumer Sentinel Network complaints by calendar year. These figures exclude "Do Not Call" registry complaints.
Source: Federal Trade Commission.
(1) Excludes state-run insurers.
(2) Insurance Information Institute Estimates/Forecasts.
Source: NAIC, Insurance Information Institute estimates 2008-2010 based on CPI data.
(Percent of all U.S. households)
Source: Investment Company Institute, U.S. Bureau of the Census.
(Deadliest and costliest events)
Source: © Munich Re, Geo Risks Research, NatCatSERVICE. As of August 2014.
($ trillions, end of year)
(1) Data for 2003, 2005, 2006, 2007 and 2008 are estimates.
Source: Investment Company Institute.
($ billions, end of year)
(1) Preliminary data. Does not include defined benefit plans.
Source: Investment Company Institute.
($ trillions, year-end)
(1) Estimated.
Source: Investment Company Institute. 2021. 2021 Investment Company Fact Book: A Review of Trends and Activities in the U.S. Investment Company Industry. Washington, D.C. Investment Company Institute. www.icifactbook.org.
($000)
(1) Represents the midpoint jury award. Half of awards are above the median and half are below.
Source: Reprinted with permission from Current Award Trends in Personal Injury. Copyright 2009 by LRP Publications, 747 Dresher Road, P.O. Box 980, Horsham, PA 19044-0980. All rights reserved.
(1) Percentages are based on the total number of Consumer Sentinel Network complaints by calendar year. These figures exclude "Do Not Call" registry complaints.
Source: Federal Trade Commission.
($ millions)
Source: Guy Carpenter: GC Securities.
CATASTROPHE BONDS, RISK CAPITAL OUTSTANDING, 2004-2008
($ millions)
Source: Guy Carpenter: GC Securities.
(1) Data prior to 2009 not strictly comparable to earlier data.
Source: National Association of State Treasurers.
Source: LIMRA International.
Source: Federal Deposit Insurance Corporation.
(Based on dollar value)
(1) Based on a survey by claims aggregator, Enservio, of the replacement cost value of homeowners insurance property content claims. Includes items that are damaged, lost or stolen.
Source: Enservio.
(1) Securities of federal mortgage pools backing privately issued collateralized mortgage obligations (CMOs). In CMOs, mortgage principal and interest payments are separated into different payment streams to create bonds that repay capital over differing periods of time.
(2) Mortgages backing privately issued pool securities and CMOs.
(3) Treasury securities accounted for less than 1 percent in 2004.
Source: Board of Governors of the Federal Reserve System, June 11, 2009.
(Percent)
Source: Federal Deposit Insurance Corporation.
($ billions)
Source: Board of Governors of the Federal Reserve System.
(1) HECMs are federally insured reverse mortgage products.
(2) Through July 2010; fiscal year ends September 30.
Source: National Reverse Mortgage Lenders Association.
Source: Board of Governors of the Federal Reserve System, June 11, 2009.
(1) Estimated.
Source: American Bankers Association.
(1) Market value, end of year; excludes open-end mutual fund shares.
(2) Holdings of U.S. issues by foreign residents.
Source: Board of Governors of the Federal Reserve System, June 11, 2009.
(Weighted average, 2005-2009)
(1) For homeowners multiple peril policies. Excludes tenants and condominium owners policies. Accident year incurred losses, excluding loss adjustment expenses, i.e., indemnity costs per accident year incurred claims.
(2) Includes coverage for unauthorized use of various cards, forgery, counterfeit money and losses not otherwise classified.
(3) Includes vandalism and malicious mischief.
Source: ISO, a Verisk Analytics company.
(Percent change from prior year)
Source: Board of Governors of the Federal Reserve System, June 11, 2009.
(Weighted average, 2005-2009)
(1) Claims per 100 house years (policies). For homeowners multiple peril policies. Excludes tenants and condominium owners policies.
(2) Includes vandalism and malicious mischief.
(3) Includes coverage for unauthorized use of various cards, forgery, counterfeit money and losses not otherwise classified.
Source: ISO, a Verisk Analytics company.
($ billions, end of year)
Source: Board of Governors of the Federal Reserve System, June 11, 2009.
(1) Average annual growth from 1970 through 1993; marks the beginning of the shift to managed care.
(2) Projected.
Source: Centers for Medicare and Medicaid Services, Office of the Actuary.
Source: Board of Governors of the Federal Reserve System, June 11, 2009.
(1) Market value, end of year; excludes open-end mutual fund shares.
(2) Holdings of U.S. issues by foreign residents.
Source: Board of Governors of the Federal Reserve System, June 9, 2011.
(1) Does not add to total due to rounding.
Source: Investment Company Institute.
(1) Percent change from prior year on an end-of-year basis.
Source: Board of Governors of the Federal Reserve System, June 9, 2011.
(1) Percentages are dollar weighted averages.
Source: Investment Company Institute.
Source: Board of Governors of the Federal Reserve System, June 9, 2011.
($ billions)
(1) Single premium contracts bought by P/C insurers to distribute awards in personal injury or wrongful death lawsuits over a period of time, rather than as lump sums.
Source: LIMRA International.
(End of year)
(1) Includes savings banks and commercial banks.
(2) Puerto Rico, the U.S. Virgin Islands, American Samoa, Guam and other U.S.-affiliated insular areas.
Source: Board of Governors of the Federal Reserve System, June 7, 2012.
($ billions)
(1) Preliminary data.
Source: Investment Company Institute.
Source: Securities Industry and Financial Markets Association.
Source: Federal Deposit Insurance Corporation.
(1) Mortgages backing privately issued pool securities and CMOs.
(2) Securities of federal mortgage pools backing privately issued collateralized mortgage obligations (CMOs). In CMOs, mortgage principal and interest payments are separated into different payment streams to create bonds that repay capital over differing periods of time.
Source: Board of Governors of the Federal Reserve System, June 9, 2011.
Source: Investment Company Institute.
($ billions)
Source: Board of Governors of the Federal Reserve System.
Source: Board of Governors of the Federal Reserve System, June 9, 2011.
Source: © Munich Re, Geo Risks Research, NatCatSERVICE. As of March 29, 2010.
($ billions)
(1) Includes individuals (including proprietors and partnerships), nonprofit institutions primarily serving individuals, life insurance carriers and miscellaneous entities.
Source: U.S. Department of Commerce, Bureau of Economic Analysis.
(1) Excludes state funds.
Source: ISO.
(1) Based on complaints submitted to the Internet Crime Complaint Center.
Source: Internet Crime Complaint Center.
(1) Catastrophes are all events causing direct insured losses to property of $25 million or more in 2008 dollars. Adjusted for inflation by ISO.
(2) Excludes snow.
(3) Does not include flood damage covered by the federally administered National Flood Insurance Program.
(4) Includes civil disorders, water damage, fires other than wildlfires and utility service disruptions.
Source: ISO's Property Claim Services unit (PCS).
Source: 1900-1950: U.S. Census Bureau, Census of Housing. 1960-present: U.S. Census Bureau, Housing Vacancy Survey.
(1) Excluding state funds and residual markets.
Source: ISO.
Source: Sallie Mae.
(1) Gross direct premiums. Total premiums for 2008 were $1,626 billion.
(2) Blue Cross/Blue Shield, HMOs and hospital, medical and dental indemnity.
Source: National Association of Insurance Commissioners. Reprinted with permission. Further reprint or redistribution strictly prohibited without written permission of NAIC.
Source: © 2012 Munich Re, Geo Risks Research, NatCatSERVICE. As of January 2012.
Source: U.S. Department of Commerce, Bureau of Economic Analysis.
(1980 – 2011)
Source: © 2012 Münchener Rückversicherungs-Gesellschaft, Geo Risks Research, NatCatSERVICE. As of January 2012.
Source: U.S. Department of Commerce, Bureau of Economic Analysis.
(Overview and comparison with previous years)
Source: © 2012 Munich Re, Geo Risks Research, NatCatSERVICE. As of July 2012.
($ billions)
(1) Represents homeowners' cash withdrawals from home mortgage refinance transactions. Includes prime conventional loans only and is net of retirement of outstanding second mortgages.
(2) Estimated.
Source: Freddie Mac.
(Number of relevant events by peril)
Source: © 2019 Munich Re, Geo Risks Research, NatCatSERVICE. As of March 2019.
($ billions)
(1) Includes individuals; nonprofit institutions primarily serving individuals; private noninsured welfare funds; and private trust funds.
Source: U.S. Department of Commerce, Bureau of Economic Analysis.
Source: © 2019 Munich Re, Geo Risks Research, NatCatSERVICE. As of March 2019.
($ billions)
Source: LIMRA International, The 2008 Individual Annuity Market - Sales and Assets Report.
(The five costliest natural catastrophes for the insurance industry)
Source: © 2013 Munich Re, Geo Risks Research, NatCatSERVICE. As of January 2013.
Source: © 2021 Munich Re, Geo Risks Research, NatCatSERVICE. As of January 2021.
(Percent, end of year)
Source: Federal Deposit Insurance Corporation.
(1980 – 2011)
Source: © 2012 Münchener Rückversicherungs-Gesellschaft, Geo Risks Research, NatCatSERVICE. As of January 2012.
($ billions)
(1) Estimated.
Source: Kehrer-LIMRA.
Source: © 2012 Munich Re. NatCatSERVICE.
Source: Swiss Re, sigma, No. 3/2009.
(Number of events, Annual totals 1980–2010 vs. first six months 2011)
Source: © 2012 Munich Re. NatCatSERVICE.
(Percent change from prior year)
(1) Net premiums written, excluding state funds.
(2) Premiums and annuity considerations for life/health insurance companies. Includes deposit-type funds beginning in 2001.
Source: National Association of Insurance Commissioners (NAIC) Annual Statement Database, via Highline Data, LLC. Copyrighted information. No portion of this work may be copied or redistributed without the express written permission of Highline Data, LLC.
Source: © 2014 Munich Re, NatCatSERVICE; NOAA. As of January 2014.
($ billions)
Source: National Association of Insurance Commissioners (NAIC) Annual Statement Database, via Highline Data, LLC. Copyrighted information. No portion of this work may be copied or redistributed without the express written permission of Highline Data, LLC.
Source: © 2012 Munich Re, The Property Claim Services (PCS) unit of ISO, NatCatSERVICE, National Flood Insurance Plan.
(1) Excluding state funds.
Source: National Association of Insurance Commissioners (NAIC) Annual Statement Database, via Highline Data, LLC. Copyrighted information. No portion of this work may be copied or redistributed without the express written permission of Highline Data, LLC.
*2004 fires and acres do not include state lands for North Carolina.
Source: National Interagency Fire Center.
Source: SNL Financial LC.
($ billions, 2014 dollars)
(1) Does not include National Flood Insurance Program losses.
*Through 6/30/15 in 2015 dollars.
Note: 2001 figure includes $20.3B for 9/11 losses reported through 12/31/01 ($25.9B 2011 dollars). Includes only business and personal property claims, business interruption and auto claims. Non-prop/BI losses = $12.2B ($15.6B in 2011 dollars.)
Source: Property Claim Services (PCS®), a Verisk Analytics® business; AonBenfield; Insurance Information Institute. As of June 2015.
(1) Based on net premiums written, excluding state funds.
Source: ISO.
(1) Property/casualty: net premiums written, excluding state funds; Life/health: premiums, annuity considerations (fees for annuity contracts) and deposit-type funds.
Source: SNL Financial LC.
(1) Short-term and long-term disability.
Source: Eastbridge Consultants.
(Based on first year collected premium)
(1) Includes career, multiline exclusive and home service agents.
(2) Includes brokers and personal producing general agents.
(3) No producers are involved. Does not include direct marketing efforts involving agents.
(4) Includes stockbrokers, financial institutions, worksite and other channels.
(5) Estimate.
Source: LIMRA’s Market Share by Distribution Channel Survey, LIMRA estimates.
(Percent change from prior year)
(1) Net premiums written, excluding state funds.
(2) Premiums and annuity considerations (fees for annuity contracts) for life/health insurance companies. Includes deposit-type funds beginning in 2001.
Source: SNL Financial LC.
($ billions)
(1) After reinsurance transactions, excluding state funds.
(2) Before reinsurance transactions, excluding state funds. May not match total premiums shown elsewhere in this book because of the use of different exhibits from Highline Data LLC.
(3) Includes international and miscellaneous coverages.
(4) Premiums from certain insurers that write health insurance but file financial statements with state regulators on a property/casualty rather than life/health basis.
(5) Only includes nonproportional reinsurance, an arrangement in which a reinsurer makes payments to an insurer whose losses exceed a predetermined amount.
(6) Coverages protecting against legal liability resulting from negligence, carelessness, or failure to act.
Source: National Association of Insurance Commissioners (NAIC) Annual Statement Database, via Highline Data, LLC. Copyrighted information. No portion of this work may be copied or redistributed without the express written permission of Highline Data, LLC.
($ billions)
(1) After reinsurance transactions, excluding state funds.
(2) Before reinsurance transactions; includes some state funds.
(3) Includes international and miscellaneous coverages.
(4) Premiums from certain insurers that write health insurance but file financial statements with state regulators on a property/casualty rather than life/health basis.
(5) Only includes nonproportional reinsurance, an arrangement in which a reinsurer makes payments to an insurer whose losses exceed a predetermined amount.
(6) Coverages protecting against legal liability resulting from negligence, carelessness, or failure to act.
Source: SNL Financial LC.
(1) HECMs are federally insured reverse mortgage products.
(2) Through July 2009; fiscal year ends September 30.
Source: National Reverse Mortgage Lenders Association.
(Percent)
Source: U.S. Department of Commerce, Census Bureau; U.S. Department of Housing and Urban Development, Office of Policy Development and Research.
($ billions)
(1) Estimated.
Source: BISRA (formerly Kehrer-LIMRA).
(Percent)
Source: U.S. Department of Commerce, Census Bureau; U.S. Department of Housing and Urban Development, Office of Policy Development and Research.
Source: SNL Financial LC.
Source: U.S. Department of Commerce, Census Bureau, Census of Housing.
(Based on first year collected premium)
(1) Includes career, multiline exclusive and home service agents.
(2) Includes brokers and personal producing general agents.
(3) No producers are involved. Does not include direct marketing efforts involving agents.
(4) Includes stockbrokers, financial institutions, worksite and other channels.
(5) Estimate.
Source: LIMRA’s U.S. Individual Life Insurance Sales Survey and LIMRA estimates.
Source: National Association of Insurance Commissioners (NAIC) Annual Statement Database, via Highline Data, LLC. Copyrighted information. No portion of this work may be copied or redistributed without the express written permission of Highline Data, LLC.
(1) Short-term and long-term disability.
Source: Eastbridge Consulting Group, Inc.
($ billions)
(1) Data for 2009 and 2010 are estimated.
Source: Celent.
(1) Based on an August 2012 survey of 1,000 Americans age 18 and over.
Source: American Bankers Association.
($ billions, net premiums written)
Source: SNL Financial LC.
Source: National Association of Insurance Commissioners (NAIC) Annual Statement Database, via Highline Data, LLC. Copyrighted information. No portion of this work may be copied or redistributed without the express written permission of Highline Data, LLC.
Source: SNL Financial LC.
($ billions, net premiums written)
Source: National Association of Insurance Commissioners (NAIC) Annual Statement Database, via Highline Data, LLC. Copyrighted information. No portion of this work may be copied or redistributed without the express written permission of Highline Data, LLC.
Source: National Association of Insurance Commissioners (NAIC) Annual Statement Database, via Highline Data, LLC. Copyrighted information. No portion of this work may be copied or redistributed without the express written permission of Highline Data, LLC.
(1) Preliminary.
Source: LIMRA International.
(1) Excludes state funds.
Source: ISO, a Verisk Analytics company.
(1) Loss total does not include NYC March 2010 settlement of up to $657.5 million to compensate about 10,000 Ground Zero workers.
(2) Sum of segment totals may not equal overall total due to rounding. Adjusted to 2009 dollars using Bureau of Labor Statistics (BLS) inflation calculator.
Source: Insurance Information Institute.
(1) Excluding state funds and residual markets.
Source: ISO, a Verisk Analytics company.
Source: National Association of Insurance Commissioners (NAIC) Annual Statement Database, via Highline Data, LLC. Copyrighted information. No portion of this work may be copied or redistributed without the express written permission of Highline Data, LLC.
(1) 1 to 4 family mortgages. Excludes refinance mortgages.
Source: Federal Housing Administration (FHA).
Source: National Association of Insurance Commissioners (NAIC) Annual Statement Database, via Highline Data, LLC. Copyrighted information. No portion of this work may be copied or redistributed without the express written permission of Highline Data, LLC.
(1) Based on states where the National Council on Compensation Insurance provides ratemaking services. Represents costs for injuries that resulted in time off from work. Data for 2010 are preliminary.
Source: U.S. Bureau of Labor Statistics; National Council on Compensation Insurance.
(1) Includes other non-occupants.
Source: U.S. Department of Transportation, National Highway Traffic Safety Administration.
(1) Includes Fannie Mae and Freddie Mac. GSEs are government-sponsored enterprises.
Source: Federal Housing Finance Agency.
(1) Percent of drivers using hand-held cellphones.
Source: U.S. Department of Transportation, National Highway Traffic Safety Administration.
($ 2010 billions)
(1) Adjusted to 2010 dollars by the Insurance Information Institute using the U.S. Department of Labor BLS Calculator.
Source: Insurance Information Institute.
(1) Cash and invested assets, as of December 31, 2008.
(2) Long-term bonds with maturity dates over one year.
Source: National Association of Insurance Commissioners (NAIC) Annual Statement Database, via Highline Data, LLC.. Copyrighted information. No portion of this work may be copied or redistributed without the express written permission of Highline Data, LLC.
(1) Online survey conducted December 2011 - January 2012.
Source: Board of Governors of the Federal Reserve.
(1) After reinsurance transactions, excluding state funds.
Source: National Association of Insurance Commissioners (NAIC) Annual Statement Database, via Highline Data, LLC. Copyrighted information. No portion of this work may be copied or redistributed without the express written permission of Highline Data, LLC.
(1) Based on states where the National Council on Compensation Insurance provides ratemaking services. Represents costs for injuries that resulted in time off from work. Data for 2008 are preliminary.
Source: U.S. Bureau of Labor Statistics; National Council on Compensation Insurance.
Source: U.S. Department of Commerce, Census Bureau.
Source: © Munich Re, Geo Risks Research, NatCatSERVICE. As of June 16, 2010.
($ billions)
Source: Organization for Economic Cooperation and Development.
Source: FINRA; Securities Industry and Financial Markets Association.
(1) Long-term bonds with maturity dates over one year, as of December 31, 2010.
Source: SNL Financial LC.
(000)
Source: FINRA; Securities Industry and Financial Markets Association.
(2010 $ billions)
(1) Adjusted for inflation by ISO using the GDP implicit price deflator. Excludes catastrophes causing direct insured losses less than $25 million in 1997 dollars.
(2) Excludes snow.
(3) Does not include flood damage covered by the federally administered National Flood Insurance Program.
(4) Includes wildland fires.
(5) Includes civil disorders, water damage, and non-property losses such as those covered by workers compensation.
Source: The Property Claim Services (PCS) unit of ISO, a Verisk Analytics company.
($ billions)
Source: NYSE Euronext; Securities Industry and Financial Markets Association.
(2010 $ billions)
(1) Adjusted for inflation by ISO using the GDP implicit price deflator. Percentages do not sum to 100 because of rounding.
Source: The Property Claim Services (PCS) unit of ISO, a Verisk Analytics company.
(Percent)
(1) New York Stock Exchange reporting firms doing public business.
Source: Securities Industry and Financial Markets Association.
($ billions)
(1) Excludes state funds.
(2) Net underwriting gain/loss plus net investment income.
Source: SNL Financial LC.
($ billions)
(1) New York Stock Exchange reporting firms doing public business.
Source: Securities Industry and Financial Markets Association.
Source: SNL Financial LC.
(Percent)
(1) New York Stock Exchange reporting firms doing public business.
Source: Securities Industry and Financial Markets Association.
(1) After reinsurance transactions, excluding state funds.
Source: SNL Financial LC.
($ billions)
Source: SNL Financial LC.
(1) Cash and invested net admitted assets, as of December 31, 2010.
(2) Long-term bonds with maturity dates over one year.
Source: SNL Financial LC.
($ billions)
Source: 2006 to 2008 premiums from Business Insurance, October 5, 2009; earlier premiums from other issues.
(1) As a percent of net premiums earned.
(2) Taxes, licenses, fees, acquisitions, field supervision, collection and general expenses.
Source: SNL Financial LC.
Source: Securities Industry and Financial Markets Association.
(1) As a percent of net premiums earned.
(2) Taxes, licenses, fees, acquisitions, field supervision, collection and general expenses.
Source: SNL Financial LC.
(000)
(1) Deferred status refers to individuals eligible for future payments.
(2) Payees are retired participants or their beneficiaries receiving payments.
Source: Pension Benefit Guaranty Corporation.
Source: Insurance Institute for Highway Safety.
Source: National Association of State Treasurers.
(1) Percent of drivers using hand-held cellphones.
Source: U.S. Department of Transportation, National Highway Traffic Safety Administration.
(1) Based on the responses of banks in the survey that sell insurance products.
Source: American Bankers Insurance Association.
(1) Includes deaths resulting from conflagration, regardless of nature of injury.
(2) Inhalation and ingestion of food or other object that obstructs breathing.
Source: National Safety Council.
Source: American Bankers Insurance Association.
($ billions)
Source: Board of Governors of the Federal Reserve System, June 9, 2011.
Source: Reprinted with permission of Thomson Reuters, Current Award Trends in Personal Injury, 54th edition and earlier editions.
Source: U.S. Department of Labor, Bureau of Labor Statistics.
(1) Represents the midpoint jury award. Half of awards are above the median and half are below.
Source: Jury Verdict Research.
($ billions)
(1) P/C: net premiums written after reinsurance transactions, excludes state funds; life/annuity: premiums, annuity considerations (fees for annuity contracts) and deposit-type funds. Both sectors include accident and health insurance.
Source: NAIC data, sourced from S&P Global Market Intelligence: Insurance Expense Exhibits, Summary of Operations; Insurance Information Institute.
($ billions)
Source: 2008 to 2010 premiums from Business Insurance, October 10, 2011; earlier premiums from other issues.
Source: Insurance Institute for Highway Safety.
(1) Based on net premiums written, excluding state funds.
Source: ISO, a Verisk Analytics company.
Source: Securities Industry and Financial Markets Association.
(000)
Source: Securities Industry and Financial Markets Association.
(Insured losses, 2009, $ Billions)
(Percent)
(1) New York Stock Exchange reporting firms doing public business in the United States.
Source: Securities Industry and Financial Markets Association.
Sources: ISO Fast Track Data, Security First Insurance
($ billions)
(1) New York Stock Exchange reporting firms doing public business in the United States.
Source: Securities Industry and Financial Markets Association.
Sources: ISO Fast Track Data, Security First Insurance
($ billions)
Source: NYSE Euronext; Securities Industry and Financial Markets Association.
Sources: ISO Fast Track Data, Security First Insurance
($ billions)
Source: NYSE Euronext; Securities Industry and Financial Markets Association.
(Pérdidas aseguradas en costos de 2009, en miles de millones o “Billions”)
($ billions)
(1) Sales are gross premiums written.
Source: Organization for Economic Cooperation and Development.
($ billions)
Source: Board of Governors of the Federal Reserve System, June 5, 2008.
Source: U.S. Department of Labor, Bureau of Labor Statistics.
(1) Electronic benefits transfer.
(2) Automated clearing house.
Source: Federal Reserve System.
(1) Based on plaintiff and defendant verdicts rendered.
Source: Jury Verdict Research.
Percentageof Claims Closed With Payment
Source: IRC
Source: © 2012 Munich Re, Geo Risks Research, NatCatSERVICE. As of July 2012.
(1) State Children's Health Insurance Program.
(2) Includes co-pays, deductibles, and treatments not covered by private health insurance.
(3) Includes programs such as workers’ compensation, public health activity, Department of Defense, Department of Veterans Affairs, Indian Health Service, state and local hospital subsidies and school health.
(4) Includes industrial in-plant, privately funded construction and non-patient revenues, including philanthropy.
Source: Centers for Medicare and Medicaid Services, Office of the Actuary, National Health Statistics Group.
(The five costliest natural catastrophes for the insurance industry)
Source: PCS - Property Claim Services; © 2012 Munich Re, Geo Risks Research, NatCatSERVICE. As of July 2012.
(1) Average annual growth from 1970 through 1993; marks the beginning of the shift to managed care.
(2) Projected.
Source: Centers for Medicare and Medicaid Services, Office of the Actuary.
(Overall and insured losses, annual totals 1980–2011 vs. first six months 2012)
Source: © 2012 Munich Re, Geo Risks Research, NatCatSERVICE. As of July 2012.
(Number of events, annual totals 1980 – 2011 vs. first six months 2012)
Source: © 2012 Munich Re, Geo Risks Research, NatCatSERVICE. As of July 2012.
(Number of Events, Annual Totals 1980–2011 vs. First Six Months 2012)
Source: © 2012 Munich Re, NatCatSERVICE. As of July 2012.
Source: ISO/PCI Fast Track data; Insurance Information Institute.
(1980 – 2012; Annual totals 1980 – 2011 vs. First six months 2012)
Source: © 2012 Munich Re, NatCatSERVICE; The Property Claim Services (PCS) unit of ISO. As of July 2012.
Fuente: ISO/PCI Fast Track; Insurance Information Institute.
($ billions, 2011 dollars)
*PCS figure for Q1 2012.
Source: Property Claims Service/ISO; Insurance Information Institute. As of July 2012.
(1) Based on participants in the survey that reported one or more claims over the 10-year period.
Source: 2008 Directors and Officers Liability Survey, Towers Watson.
Source: © 2012 Munich Re, NatCatSERVICE; NOAA. As of July 2012.
(1) Based on participants in the survey that reported one or more claims over the 10-year period.
NA=Not applicable.
Source: 2008 Directors and Officers Liability Survey, Towers Watson.
Source: 2012 Munich Re, NatCatSERVICE; The Property Claim Services (PCS) unit of ISO; National Flood Insurance Plan. As of July 2012.
(1) Based on participants in the survey that reported one or more claims over the 10-year period.
Source: 2008 Directors and Officers Liability Survey, Towers Watson.
(Annual Totals 1980–2011 vs. First Six Months 2012)
Source: 2012 Munich Re, NatCatSERVICE; The Property Claim Services (PCS) unit of ISO. As of July 2012.
Source: © Munich Re, Geo Risks Research, NatCatSERVICE. As of September 2010.
Source: © 2012 Munich Re, NatCatSERVICE. As of July 2012.
Source: © Munich Re, Geo Risks Research, NatCatSERVICE – As at 11 March 2011.
Source: U.S. Department of Commerce, Storm Prediction Center, National Weather Service.
(1) Percentages are based on the total number of Consumer Sentinel Network complaints by calendar year. These figures exclude "Do Not Call" registry complaints.
Source: Federal Trade Commission.
(000)
Source: U.S. Department of Labor, Bureau of Labor Statistics.
(2016 $ billions)
(1) Adjusted for inflation through 2016 by ISO using the GDP implicit price deflator. Excludes catastrophes causing direct losses less than $25 million in 1997 dollars. Excludes flood damage covered by the federally administered National Flood Insurance Program.
(2) Includes the other 47 states plus Washington, D.C., Puerto Rico, and the U.S. Virgin Islands.
Source: The Property Claim Services® (PCS®) unit of ISO®, a Verisk Analytics® company.
(1) Based on participants in the survey that reported one or more claims over the 10-year period.
Source: 2011 Directors and Officers Liability Survey, Towers Watson.
(000)
Source: U.S. Department of Labor, Bureau of Labor Statistics.
(1) Based on participants in the survey that reported one or more claims over the 10-year period.
Source: 2011 Directors and Officers Liability Survey, Towers Watson.
Source: U.S. Department of Commerce, Bureau of Economic Analysis.
($ billions)
Source: Organization for Economic Cooperation and Development.
Source: U.S. Department of Commerce, Bureau of Economic Analysis.
($ billions)
(1) Projected.
Source: Celent.
Source: © 2010 Munich Re, Geo Risks Research, NatCatSERVICE. As of February 2011.
($ millions)
(1) Based on total new premium.
Source: BISRA (formerly Kehrer-LIMRA).
($ trillions, end of year)
(1) Data for 2003, 2005, 2006, 2007, 2008 and 2009 are estimates.
Source: Investment Company Institute.
(1) Based on an August 2011 survey of 2,011 Americans age 18 and over.
Source: American Bankers Association.
(1) Includes deaths resulting from conflagration, regardless of nature of injury.
(2) Inhalation and ingestion of food or other object that obstructs breathing.
Source: National Safety Council.
Source: © 2011 Munich Re. NatCatSERVICE.
($ 2011 billions)
(1) Adjusted to 2011 dollars by the Insurance Information Institute using the U.S. Department of Labor BLS Calculator.
Source: Insurance Information Institute.
Source: © 2011 Munich Re. NatCatSERVICE.
(1) Percent of drivers using hand-held cellphones.
Source: U.S. Department of Transportation, National Highway Traffic Safety Administration.
(1) May not add to total due to rounding.
Source: Investment Company Institute.
(Weighted average, 2006-2010)
(1) For homeowners multiple peril policies. Excludes tenants and condominium owners policies. Accident year incurred losses, excluding loss adjustment expenses, i.e., indemnity costs per accident year incurred claims.
(2) Includes coverage for unauthorized use of various cards, forgery, counterfeit money and losses not otherwise classified.
(3) Includes vandalism and malicious mischief.
Source: ISO, a Verisk Analytics company.
(1) Percentages are dollar-weighted averages.
Source: Investment Company Institute.
(1) Includes other non-occupants.
Source: U.S. Department of Transportation, National Highway Traffic Safety Administration.
($ billions, end of year)
(1) Preliminary data.
Source: Investment Company Institute.
Source: Insurance Institute for Highway Safety.
Source: U.S. Bureau of Labor Statistics, Current Population Survey.
(1) Top ten events in original insured loss dollars were adjusted to and ranked by the Insurance Information Institute to 2013 inflation-adjusted values.
Source: Munich Re NatCatSERVICE; Insurance Information Institute.
Source: Munich Re NatCatSERVICE; Insurance Information Institute.
($ 2012 billions)
(1) Adjusted to 2012 dollars by the Insurance Information Institute using the U.S. Department of Labor BLS Calculator.
(2) Loss total does not include March 2010 New York City settlement of up to $657.5 million to compensate approximately 10,000 Ground Zero workers or any subsequent settlements.
Source: Insurance Information Institute.
Sources: Munich Re NatCatSERVICE; Insurance Information Institute.
(1) Top ten events in original insured loss dollars were adjusted to and ranked by the Insurance Information Institute to 2013 inflation-adjusted values.
Source: Munich Re NatCatSERVICE; Insurance Information Institute.
(insured losses, millions $2013)
Source: Munich Re NatCatSERVICE; Insurance Information Institute.
(2012 $ billions)
(1) Adjusted for inflation through 2012 by ISO using the GDP implicit price deflator. Excludes catastrophes causing direct losses less than $25 million in 1997 dollars. Excludes flood damage covered by the federally administered National Flood Insurance Program.
(2) Includes losses from other perils that frequently accompany tornadoes such as hail, wind and thunderstorms. Excludes snow.
(3) Includes wildland fires.
(4) Includes losses from civil disorders, water damage, utility service disruptions, and any workers compensation catastrophes generating losses in excess of PCS's threshold after adjusting for inflation.
Source: Property Claim Services (PCS), a division of Verisk Analytics.
(1) Percentages are dollar-weighted averages.
Source: Investment Company Institute.
(1) Excludes Puerto Rico. Excludes tornadoes crossing state lines. Counts these tornadoes as one event.
Source: U.S. Department of Commerce, Storm Prediction Center, National Weather Service.
(Weighted average, 2006-2010)
(1) Claims per 100 house years (policies). For homeowners multiple peril policies. Excludes tenants and condominium owners policies.
(2) Includes vandalism and malicious mischief.
(3) Includes coverage for unauthorized use of various cards, forgery, counterfeit money and losses not otherwise classified.
Source: ISO, a Verisk Analytics company.
Source: U.S. Bureau of Labor Statistics, Current Population Survey.
(Weighted average, 2007-2011)
(1) For homeowners multiple peril policies. Excludes tenants and condominium owners policies. Accident year incurred losses, excluding loss adjustment expenses, i.e., indemnity costs per accident year incurred claims.
(2) Includes coverage for unauthorized use of various cards, forgery, counterfeit money and losses not otherwise classified.
(3) Includes vandalism and malicious mischief.
Source: ISO, a Verisk Analytics company.
(Weighted average, 2007-2011)
(1) Claims per 100 house years (policies). For homeowners multiple peril policies. Excludes tenants and condominium owners policies.
(2) Includes vandalism and malicious mischief.
(3) Includes coverage for unauthorized use of various cards, forgery, counterfeit money and losses not otherwise classified.
Source: ISO, a Verisk Analytics company.
(1) Percent of drivers using hand-held cellphones.
Source: U.S. Department of Transportation, National Highway Traffic Safety Administration.
(1) Percentages are based on the total number of Consumer Sentinel Network complaints by calendar year. These figures exclude "Do Not Call" registry complaints.
Source: Federal Trade Commission.
(1) Inhalation and ingestion of food or other object that obstructs breathing.
Source: National Safety Council.
Source: Insurance Institute for Highway Safety.
Source: © 2014 Munich Re, NatCatSERVICE. As of January 2014.
Source: U.S. Department of Commerce, Storm Prediction Center, National Weather Service.
($ billions)
Source: Organization for Economic Cooperation and Development.
(2019 $ millions)
(1) Adjusted for inflation by Munich Re based on the Consumer Price Index.
Source: © 2020 Munich Re, NatCatSERVICE.
(1) Short-term and long-term disability.
Source: Eastbridge Consulting Group, Inc.
(Based on first year collected premium)
(1) Includes brokers, stockbrokers and personal producing general agents.
(2) Includes career, multiline exclusive and home service agents.
(3) No producers are involved. Does not include direct marketing efforts involving agents.
(4) Includes financial institutions, worksite and other channels.
(5) Estimate.
Source: LIMRA’s U.S. Individual Life Insurance Sales Survey and LIMRA estimates.
($ millions)
(1) Based on total new premiums.
Source: Bank Insurance and Securities Research Associates (BISRA).
(1) Property/casualty: net premiums written, excludes state funds; life/health: premiums, annuity considerations (fees for annuity contracts) and deposit-type funds.
Source: SNL Financial LC.
(Percent change from prior year)
(1) Net premiums written, excludes state funds.
(2) Premiums, annuity considerations (fees for annuity contracts) and deposit-type funds for life/health insurance companies.
Source: SNL Financial LC.
($ trillions, year-end)
(1) Estimated.
Source: Investment Company Institute.
Source: Board of Governors of the Federal Reserve System, June 6, 2013.
(Market value, end of year)
(1) Includes savings banks, commercial banks and Keogh accounts.
(2) Includes Keogh accounts.
(3) Excludes variable annuities.
Source: Board of Governors of the Federal Reserve System, June 6, 2013.
.
($ billions, end of year)
(1) Preliminary data. Excludes defined benefit plans.
Source: Investment Company Institute.
($ billions, end of year)
(1) Not reported before 2010.
Source: LIMRA International.
($ billions)
(1) Includes variable individual annuities sales which were less than $0.1 billion.
(2) Single premium contracts bought by property/casualty insurers to distribute awards in personal injury or wrongful death lawsuits over a period of time, rather than as lump sums.
Source: LIMRA International.
(1) Includes other non-occupants.
Source: U.S. Department of Transportation, National Highway Traffic Safety Administration.
Source: Thomson Reuters, Jury Verdict Research Series.
(1) Represents the midpoint jury award. Half of the awards are above the median and half are below.
Source: Thomson Reuters, Jury Verdict Research Series.
Source: Thomson Reuters, Jury Verdict Research Series.
(2012 $ billions)
(1) Adjusted for inflation through 2012 by ISO using the GDP implicit price deflator. Excludes catastrophes causing direct losses less than $25 million in 1997 dollars. Excludes flood damage covered by the federally administered National Flood Insurance Program.
(2) Includes losses from other perils that frequently accompany tornadoes such as hail, wind and thunderstorms. Excludes snow.
(3) Includes wildland fires.
(4) Includes losses from civil disorders, water damage, utility service disruptions, and any workers compensation catastrophes generating losses in excess of PCS's threshold after adjusting for inflation.
Source: Property Claim Services (PCS), a division of Verisk Analytics.
(1) Long-term bonds with maturity dates over one year, as of December 31, 2012.
Source: SNL Financial LC.
(1) Based on participants in the survey that reported one or more claims over the 10-year period.
Source: 2012 Directors and Officers Liability Survey, Towers Watson.
(1) Based on participants in the survey that reported one or more claims over the 10-year period.
Source: 2012 Directors and Officers Liability Survey, Towers Watson.
(1) After reinsurance transactions, excludes state funds.
Source: SNL Financial LC.
($ billions)
(1) Excludes state funds.
(2) Net underwriting gain/loss plus net investment income.
Source: SNL Financial LC.
($ billions)
(1) Less than $0.01 billion.
(2) After reinsurance transactions, excludes state funds.
(3) Before reinsurance transactions, includes some state funds.
(4) Includes international and miscellaneous coverages.
(5) Premiums from certain insurers that write health insurance but file financial statements with state regulators on a property/casualty rather than life/health basis.
(6) Only includes nonproportional reinsurance, an arrangement in which a reinsurer makes payments to an insurer whose losses exceed a predetermined amount.
(7) Coverages protecting against legal liability resulting from negligence, carelessness, or failure to act.
Source: SNL Financial LC.
($ billions, net premiums written)
Source: SNL Financial LC.
($ billions, net premiums written)
Source: SNL Financial LC.
Source: SNL Financial LC.
(1) Cash and invested net admitted assets, as of December 31, 2012.
Source: SNL Financial LC.
(1) Excludes state funds.
Source: ISO, a Verisk Analytics company.
(1) Excludes state funds and residual markets.
Source: ISO, a Verisk Analytics company.
(2012 $ billions)
(1) Adjusted for inflation through 2012 by ISO using the GDP implicit price deflator. Excludes catastrophes causing direct losses less than $25 million in 1997 dollars. Excludes flood damage covered by the federally administered National Flood Insurance Program.
(2) Includes the other 47 states plus Washington, D.C., Puerto Rico, and the U.S. Virgin Islands.
Source: Property Claim Services (PCS), a division of Verisk Analytics.
(1) Preliminary.
Source: LIMRA International.
(1) Based on states where the National Council on Compensation Insurance provides ratemaking services. Represents costs for injuries that resulted in time off from work. Data for 2012 are preliminary.
Source: U.S. Bureau of Labor Statistics; National Council on Compensation Insurance.
(1) Average annual growth from 1970 through 1993; marks the beginning of the shift to managed care.
(2) Projected.
Source: Centers for Medicare and Medicaid Services, Office of the Actuary.
($ billions)
Source: 2010 to 2012 premiums from Business Insurance (www.businessinsurance.com), September 23, 2013; earlier premiums from other issues.
(1) Based on complaints submitted to the Internet Crime Complaint Center.
Source: Internet Crime Complaint Center.
Source: U.S. Department of Labor, Bureau of Labor Statistics.
(1) Includes private insurance and FAIR plans.
Source: ISO®, a Verisk Analytics® company.
Source: © Munich Re, Geo Risks Research, NatCatSERVICE. As of April 2010.
(1) Based on plaintiff and defendant verdicts rendered.
Source: Reprinted with permission of Thomson Reuters, Employment Practice Liability, Jury Award Trends And Statistics, 2013 edition.
(1) Based on net premiums written, excludes state funds and other residual market carriers.
Source: ISO®, a Verisk Analytics® company.
Source: © 2014 Munich Re, Geo Risks Research, NatCatSERVICE. As of January 2014.
Source: © 2014 Munich Re, Geo Risks Research, NatCatSERVICE. As of January 2014.
($ millions)
Source: © 2014 Munich Re, Geo Risks Research, NatCatSERVICE. As of January 2014.
Source: © 2015 Munich Re, Geo Risks Research, NatCatSERVICE. As of January 2015.
($ millions)
(Overall and insured losses)
Source: © 2014 Munich Re, Geo Risks Research, NatCatSERVICE. As of January 2014.
(Number of events)
Source: © 2014 Munich Re, Geo Risks Research, NatCatSERVICE. As of January 2014.
Source: © 2014 Munich Re, NatCatSERVICE. As of January 2014.
(Overall and insured losses)
Source: © 2014 Munich Re, NatCatSERVICE; Property Claim Services (PCS), a division of Verisk Analytics. As of January 2014.
(Number of events)
Source: © 2014 Munich Re, NatCatSERVICE. As of January 2014.
(Annual totals 1980–2013)
Source: 2014 Munich Re, NatCatSERVICE; Property Claim Services (PCS), a division of Verisk Analytics. As of January 2014.
(Annual totals 1980 – 2011)
Source: © 2012 Munich Re, NatCatSERVICE.
($ millions)
Source: © 2014 Munich Re, Geo Risks Research, NatCatSERVICE. As of January 2014.
Source: © 2014 Munich Re, Geo Risks Research, NatCatSERVICE. As of January 2014.
Source: © 2014 Munich Re, NatCatSERVICE. As of January 2014.
(Based on perils)
Source: © 2016 Munich Re, NatCatSERVICE; Property Claim Services (PCS®)*, a Verisk Analytics® business. As of March 2016.
(2014 $ millions)
(1) Includes losses due to winter damage, blizzard, snow storm and cold wave.
Source: © 2015 Munich Re, Geo Risks Research, NatCatSERVICE, as of January 2015.
($ billions)
Source: GC Securities, a division of MMC Securities Corp., a U.S. registered broker-dealer, member FINRA/SIPC, and Guy Carpenter.
($ billions)
Source: GC Securities, a division of MMC Securities Corp., a U.S. registered broker-dealer, member FINRA/SIPC, and Guy Carpenter.
(1) As of April 30, 2013.
Source: Federal Emergency Management Agency (FEMA).
Source: U.S. Bureau of Labor Statistics, Current Population Survey.
($ billions)
Source: Organization for Economic Cooperation and Development.
(Weighted average, 2008-2012)
(1) For homeowners multiple peril policies. Excludes tenants and condominium owners policies. Accident year incurred losses, excluding loss adjustment expenses, i.e., indemnity costs per accident year incurred claims.
(2) Includes vandalism and malicious mischief.
(3) Includes coverage for unauthorized use of various cards, forgery, counterfeit money and losses not otherwise classified.
Source: ISO®, a Verisk Analytics® company.
(Weighted average, 2008-2012)
(1) Claims per 100 house years (policies). For homeowners multiple peril policies. Excludes tenants and condominium owners policies.
(2) Includes vandalism and malicious mischief.
(3) Includes coverage for unauthorized use of various cards, forgery, counterfeit money and losses not otherwise classified.
Source: ISO®, a Verisk Analytics® company.
(1) Percentages are based on the total number of Consumer Sentinel Network complaints by calendar year. These figures exclude "Do Not Call" registry complaints.
Source: Federal Trade Commission.
Source: U.S. Department of Commerce, National Oceanic and Atmospheric Administration, National Weather Service.
($ billions, 2012 dollars)
(1) Does not include National Flood Insurance Program losses.
*As of 1/2/13. Includes $18.8B gross loss estimate for Hurricane Sandy.
Note: 2001 figure includes $20.3B for 9/11 losses reported through 12/31/01 ($25.9B 2011 dollars). Includes only business and personal property claims, business interruption and auto claims. Non-prop/BI losses = $12.2B ($15.6B in 2011 dollars.)
Source: The Property Claim Services® (PCS®) unit of ISO®, a Verisk Analytics® company; Insurance Information Institute. As of January 2013.
(1) Excludes Puerto Rico. A tornado that crosses state lines is counted as a single event in this chart.
Source: U.S. Department of Commerce, Storm Prediction Center, National Weather Service.
(1) Inhalation and ingestion of food or other object that obstructs breathing.
Source: National Safety Council. (2014). Injury Facts®, 2014 Edition. Itasca, IL.
(2013 $ billions)
(1) Adjusted for inflation through 2013 by ISO using the GDP implicit price deflator. Excludes catastrophes causing direct losses less than $25 million in 1997 dollars. Excludes flood damage covered by the federally administered National Flood Insurance Program.
(2) Includes other wind, hail, and/or flood losses associated with catastrophes involving tornadoes.
(3) Includes wildland fires.
(4) Includes losses from civil disorders, water damage, utility service disruptions, and any workers compensation catastrophes generating losses in excess of PCS's threshold after adjusting for inflation.
Source: The Property Claim Services® (PCS®) unit of ISO®, a Verisk Analytics® company.
(2013 $ billions)
(1) Adjusted for inflation through 2013 by ISO using the GDP implicit price deflator. Excludes catastrophes causing direct losses less than $25 million in 1997 dollars. Excludes flood damage covered by the federally administered National Flood Insurance Program.
(2) Includes the other 47 states plus Washington, D.C., Puerto Rico, and the U.S. Virgin Islands.
Source: The Property Claim Services® (PCS®) unit of ISO®, a Verisk Analytics® company.
Source: Insurance Institute for Highway Safety.
Source: © 2014 Munich Re. NatCatSERVICE; National Interagency Fire Center. As of January 2014.
($ billions, end of year)
(1) Not reported before 2010.
Source: LIMRA Secure Retirement Institute.
($ billions)
(1) Includes variable individual annuities sales which were less than $0.1 billion.
(2) Single premium contracts bought by property/casualty insurers to distribute awards in personal injury or wrongful death lawsuits over a period of time, rather than as lump sums.
Source: LIMRA Secure Retirement Institute.
Source: U.S. Department of Transportation, National Highway Traffic Safety Administration.
(2013 $ millions)
(1) Adjusted for inflation.
Source: © 2014 Munich Re, Geo Risks Research, NatCatSERVICE.
($ billions, end of year)
(1) Preliminary data. Excludes defined benefit plans.
Source: Investment Company Institute, Investment Company Fact Book 2014. www.ici.org.
(1) Includes other non-occupants.
Source: U.S. Department of Transportation, National Highway Traffic Safety Administration.
Source: Board of Governors of the Federal Reserve System, June 5, 2014.
Source: Swiss Re, sigma, No. 3/2014.
Source: Reprinted with permission of Thomson Reuters, Current Award Trends in Personal Injury, 53rd edition.
Source: Reprinted with permission of Thomson Reuters, Current Award Trends in Personal Injury, 53rd edition and earlier editions.
(1) Represents the midpoint jury award. Half of the awards are above the median and half are below.
Source: Reprinted with permission of Thomson Reuters, Current Award Trends in Personal Injury, 53rd edition.
Source: © 2015 Munich Re, NatCatSERVICE. As of January 2015.
(Overall and insured losses)
Source: © 2015 Munich Re, NatCatSERVICE; Property Claim Services (PCS), a division of Verisk Analytics. As of January 2015.
(Number of events)
Source: © 2015 Munich Re, NatCatSERVICE. As of January 2015.
(2014 $ billions)
Source: 2015 Munich Re, NatCatSERVICE; Property Claim Services (PCS), a division of Verisk Analytics. As of January 2015.
Source: U.S. Department of Commerce, National Oceanic and Atmospheric Administration, National Weather Service.
($ billions, 2013 dollars)
(1) Does not include National Flood Insurance Program losses.
*Through 12/31/14.
Note: 2001 figure includes $20.3B for 9/11 losses reported through 12/31/01 ($25.9B 2011 dollars). Includes only business and personal property claims, business interruption and auto claims. Non-prop/BI losses = $12.2B ($15.6B in 2011 dollars.)
Source: The Property Claim Services® (PCS®) unit of ISO®, a Verisk Analytics® company; Insurance Information Institute. As of January 2014.
Source: © 2015 Munich Re, Geo Risks Research, NatCatSERVICE. As of January 2015.
Source: © 2015 Munich Re, Geo Risks Research, NatCatSERVICE. As of January 2015.
($ millions)
Source: © 2015 Munich Re, Geo Risks Research, NatCatSERVICE. As of January 2015.
($ millions)
Source: © 2015 Munich Re, Geo Risks Research, NatCatSERVICE. As of January 2015.
(1) Long-term bonds with maturity dates over one year, as of December 31, 2013.
Source: SNL Financial LC.
(Based on first year collected premium)
(1) Includes brokers, stockbrokers and personal producing general agents.
(2) Includes career, multiline exclusive and home service agents.
(3) No producers are involved. Excludes direct marketing efforts involving agents.
(4) Includes financial institutions, worksite and other channels.
(5) Estimate.
Source: LIMRA’s U.S. Individual Life Insurance Sales Survey and LIMRA estimates.
(1) Excludes state funds.
Source: ISO®, a Verisk Analytics® company.
(1) Excludes state funds and other residual insurers.
Source: ISO®, a Verisk Analytics® company.
($ trillions, year-end)
(1) Estimated.
Source: Investment Company Institute, The U.S. Retirement Market, Fourth Quarter 2013. www.ici.org.
(1) Percentages are dollar-weighted averages.
Source: Investment Company Institute, ICI Research Perspective, 19 no. 12. www.ici.org.
(Percent change from prior year)
(1) Net premiums written after reinsurance transactions, excludes state funds.
(2) Premiums, annuity considerations (fees for annuity contracts) and deposit-type funds for life/health insurance companies.
Source: SNL Financial LC.
(1) Property/casualty: net premiums written after reinsurance transactions, excludes state funds; life/health: premiums, annuity considerations (fees for annuity contracts) and deposit-type funds.
Source: SNL Financial LC.
($ billions)
(1) Excludes state funds.
(2) Net underwriting gain/loss plus net investment income.
Source: SNL Financial LC.
(1) After reinsurance transactions, excludes state funds.
Source: SNL Financial LC.
(1) Cash and invested net admitted assets, as of December 31, 2013.
Source: SNL Financial LC.
(1) Based on participants in the survey that reported one or more claims over the 10-year period.
Source: 2013 Directors and Officers Liability Survey, JLT PARK Ltd.
($ billions)
(1) After reinsurance transactions, excludes state funds.
(2) Before reinsurance transactions, includes some state funds.
(3) Includes international and miscellaneous coverages.
(4) Premiums from certain insurers that write health insurance but file financial statements with state regulators on a property/casualty rather than life/health basis.
(5) Only includes nonproportional reinsurance, an arrangement in which a reinsurer makes payments to an insurer whose losses exceed a predetermined amount.
(6) Coverages protecting against legal liability resulting from negligence, carelessness or failure to act.
Source: SNL Financial LC.
(1) Short-term and long-term disability.
Source: Eastbridge Consulting Group, Inc.
Source: SNL Financial LC.
($ billions, net premiums written)
Source: SNL Financial LC.
($ billions, net premiums written)
Source: SNL Financial LC.
(1) Based on participants in the survey that reported one or more claims over the 10-year period.
Source: 2013 Directors and Officers Liability Survey, JLT PARK Ltd.
(1) Based on states where the National Council on Compensation Insurance provides ratemaking services. Represents costs for injuries that resulted in time off from work. Data for 2013 are preliminary.
Source: U.S. Bureau of Labor Statistics; ©National Council on Compensation Insurance.
($ billions)
Source: 2011 to 2013 premiums from Business Insurance (www.businessinsurance.com), September 15, 2014; earlier premiums from other issues.
(Market value, end of year)
(1) Includes savings banks, commercial banks and Keogh accounts.
(2) Includes Keogh accounts.
(3) Excludes variable annuities.
Source: Board of Governors of the Federal Reserve System, June 5, 2014.
Source: U.S. Department of Labor, Bureau of Labor Statistics.
(1) Based on complaints submitted to the Internet Crime Complaint Center.
Source: Internet Crime Complaint Center.
Source: U.S. Individual Annuity Yearbook - 2013, LIMRA Secure Retirement Institute.
(1) Based on net premiums written. Excludes state funds and other residual market carriers.
Source: ISO, a Verisk Analytics company.
(1) Estimated. Includes FAIR plan and uninsured losses.
Source: ISO, a Verisk Analytics business.
(1) Average annual growth from 1970 through 1993; marks the beginning of the shift to managed care.
(2) Projected.
Source: Centers for Medicare and Medicaid Services, Office of the Actuary.
($ 2013 billions)
(1) Adjusted to 2013 dollars by the Insurance Information Institute using the U.S. Department of Labor BLS Calculator.
(2) Loss total does not include March 2010 New York City settlement of up to $657.5 million to compensate approximately 10,000 Ground Zero workers or any subsequent settlements.
Source: Insurance Information Institute.
Source: © 2015 Munich Re, Geo Risks Research, NatCatSERVICE. As of June 2015.
Source: © 2015 Munich Re, Geo Risks Research, NatCatSERVICE. As of June 2015.
($ millions)
* Data based on information from PCS.
Source: © 2015 Munich Re, Geo Risks Research, NatCatSERVICE. As of June 2015.
($ millions)
Source: © 2015 Munich Re, Geo Risks Research, NatCatSERVICE. As of June 2015.
(Overall and insured losses)
Source: © 2015 Munich Re, Geo Risks Research, NatCatSERVICE. As of January 2015.
(Number of events)
Source: © 2015 Munich Re, Geo Risks Research, NatCatSERVICE. As of January 2015.
($ millions)
*U.S. losses from Property Claim Services.
**Time period for several severe storm events.
Source: © 2015 Munich Re, Geo Risks Research, NatCatSERVICE. As of January 2015.
*U.S. losses from Property Claim Services.
Source: © 2016 Munich Re, Geo Risks Research, NatCatSERVICE. As of January 2016.
Source: © 2015 Munich Re, Geo Risks Research, NatCatSERVICE. As of January 2015.
(2014 $ billions)
Source: 2015 Munich Re, NatCatSERVICE; Property Claim Services (PCS), a Verisk Analytics business. As of June 2015.
(2014 $ billions)
Source: 2015 Munich Re, NatCatSERVICE, as of January 2015.
(2019 $ billions)
Source: © 2020 Munich Re, Geo Risks Research, NatCatSERVICE. As of June 2020.
(Overall and insured losses)
Source: © 2015 Munich Re, NatCatSERVICE; Property Claim Services (PCS), a Verisk Analytics business. As of January 2015.
(Number of events)
Source: © 2015 Munich Re, NatCatSERVICE. As of June 2015.
© 2015 Munich Re, NatCatSERVICE; NOAA. As of June 2015.
(1) Based on plaintiff and defendant verdicts rendered.
Source: Reprinted with permission of Thomson Reuters, Employment Practice Liability: Jury Award Trends And Statistics, 2014 edition.
($ billions)
Source: GC Securities, a division of MMC Securities Corp., a U.S. registered broker-dealer, member FINRA/SIPC, and Guy Carpenter.
($ billions)
Source: GC Securities, a division of MMC Securities Corp., a U.S. registered broker-dealer, member FINRA/SIPC, and Guy Carpenter.
Source: © 2015 Munich Re, NatCatSERVICE. As of June 2015.
(1) Includes hail, lightning, and tornado.
(2) Includes winter storm, winter damage, cold wave, and blizzards.
(3) Includes river flood, and flash flood. Exclude flood damage losses caused by tropical cyclone and hurricane.
(4) Includes flooding caused by hurricane, tropical cyclone. Includes loss information from National Flood Insurance Program.
Source: © 2015 Munich Re, NatCatSERVICE. As of January 2015.
Source: © 2015 Munich Re, NatCatSERVICE. As of January 2015.
Source: U.S. Bureau of Labor Statistics, Current Population Survey.
(1) Sum of components does not add to 100 percent due to rounding.
(2) Includes co-payments, deductibles, and any amounts not covered by health insurance.
(3) Department of Veterans Affairs, Department of Defense and Children's Health Insurance Program.
Source: Centers for Medicare and Medicaid Services, Office of the Actuary, National Health Statistics Group.
(Weighted average, 2009-2013)
(1) For homeowners multiple peril policies. Excludes tenants and condominium owners policies. Accident year incurred losses, excluding loss adjustment expenses, i.e., indemnity costs per accident year incurred claims. Excludes Alaska and Texas.
(2) Includes vandalism and malicious mischief.
(3) Includes coverage for unauthorized use of various cards, forgery, counterfeit money and losses not otherwise classified.
Source: ISO®, a Verisk Analytics® business.
(Weighted average, 2009-2013)
(1) Claims per 100 house years (policies). For homeowners multiple peril policies. Excludes tenants and condominium owners policies. Excludes Alaska and Texas.
(2) Includes vandalism and malicious mischief.
(3) Includes coverage for unauthorized use of various cards, forgery, counterfeit money and losses not otherwise classified.
Source: ISO®, a Verisk Analytics® business.
(1) As of June 30, 2015.
Source: Identity Theft Resource Center.
($ 2014 billions)
(1) Adjusted to 2014 dollars by the Insurance Information Institute using the U.S. Department of Labor BLS Calculator.
(2) Loss total does not include March 2010 New York City settlement of up to $657.5 million to compensate approximately 10,000 Ground Zero workers or any subsequent settlements.
Source: Insurance Information Institute.
(2014 $ millions)
(1) Adjusted for inflation.
Source: © 2015 Munich Re, Geo Risks Research, NatCatSERVICE.
(1) As of October 2014.
Source: Federal Emergency Management Agency (FEMA).
(1) Percent of drivers using hand-held cellphones.
Source: U.S. Department of Transportation, National Highway Traffic Safety Administration.
Source: U.S. Department of Commerce, National Oceanic and Atmospheric Administration, National Weather Service.
Source: Insurance Institute for Highway Safety.
($ billions)
Source: Organization for Economic Cooperation and Development.
(1) Inhalation and ingestion of food or other object that obstructs breathing.
Source: National Safety Council. (2015). Injury Facts®, 2015 Edition. Itasca, IL.
Source: © 2016 Munich Re, Geo Risks Research, NatCatSERVICE. As of January 2016.
(Overall and insured losses)
Source: © 2016 Munich Re, Geo Risks Research, NatCatSERVICE. As of January 2016.
(Number of events)
Source: © 2016 Munich Re, Geo Risks Research, NatCatSERVICE. As of January 2016.
(Number of events)
Source: © 2016 Munich Re, NatCatSERVICE. As of January 2016.
(Overall and insured losses, 2015 $billions)
Source: © 2016 Munich Re, NatCatSERVICE; Property Claim Services (PCS), a Verisk Analytics business. As of January 2016.
(1) Includes other non-occupants.
Source: U.S. Department of Transportation, National Highway Traffic Safety Administration.
($ billions)
(1) Includes variable individual annuities sales which were less than $0.1 billion.
(2) Single premium contracts bought by property/casualty insurers to distribute awards in personal injury or wrongful death lawsuits over a period of time, rather than as lump sums.
Source: LIMRA.
(US$ billions)
Source: GC Securities, a division of MMC Securities Corp., a registered broker-dealer, member FINRA/SIPC, and Guy Carpenter.
(Based on first year collected premiums)
(1) Includes brokers, stockbrokers and personal producing general agents.
(2) Includes career, multiline exclusive and home service agents.
(3) No producers are involved. Excludes direct marketing efforts involving agents.
(4) Includes financial institutions, worksite and other channels.
Source: LIMRA’s U.S. Individual Life Insurance Sales Survey and LIMRA estimates.
($ billions, end of year)
(1) Preliminary data. Excludes defined benefit plans.
Source: Investment Company Institute, Investment Company Fact Book 2015. www.ici.org.
($ billions, end of year)
(1) Not reported before 2010.
Source: LIMRA.
Source: Board of Governors of the Federal Reserve System, June 11, 2015.
(1) Percentages are dollar-weighted averages.
Source: Investment Company Institute, ICI Research Perspective, Vol. 20 no. 10. www.ici.org.
(2014 $ billions)
(1) Adjusted for inflation through 2014 by ISO using the GDP implicit price deflator. Excludes catastrophes causing direct losses less than $25 million in 1997 dollars. Excludes flood damage covered by the federally administered National Flood Insurance Program.
(2) Includes the other 47 states plus Washington, D.C., Puerto Rico, and the U.S. Virgin Islands.
Source: Property Claim Services (PCS®), a Verisk Analytics® business.
( $ billions)
Source: Swiss Re, sigma, No. 4/2015.
($ trillions, year-end)
(1) Estimated.
Source: Investment Company Institute, The U.S. Retirement Market, First Quarter 2015. www.ici.org.
(Market value, end of year)
(1) Includes savings banks, commercial banks and Keogh accounts.
(2) Includes Keogh accounts.
(3) Excludes variable annuities.
Source: Board of Governors of the Federal Reserve System, June 11, 2015.
(2014 $ billions)
(1) Adjusted for inflation through 2014 by ISO using the GDP implicit price deflator. Excludes catastrophes causing direct losses less than $25 million in 1997 dollars. Excludes flood damage covered by the federally administered National Flood Insurance Program.
(2) Includes other wind, hail, and/or flood losses associated with catastrophes involving tornadoes.
(3) Includes wildland fires.
(4) Includes losses from civil disorders, water damage, utility service disruptions, and any workers compensation catastrophes generating losses in excess of PCS's threshold after adjusting for inflation.
Source: Property Claim Services (PCS®), a Verisk Analytics® business.
($ billions)
(1) Excludes state funds.
(2) Net underwriting gain/loss plus net investment income.
Source: SNL Financial LC.
(1) Property/casualty: net premiums written after reinsurance transactions, excludes state funds; life/health: premiums, annuity considerations (fees for annuity contracts) and deposit-type funds.
Source: SNL Financial LC.
(Percent change from prior year)
(1) Net premiums written after reinsurance transactions, excludes state funds.
(2) Premiums and annuity considerations (fees for annuity contracts) for life/health insurance companies.
Source: SNL Financial LC.
Source: SNL Financial LC.
Source: © 2016 Munich Re, Geo Risks Research, NatCatSERVICE. As of March 2016.
(Number of events)
Source: © 2016 Munich Re, Geo Risks Research, NatCatSERVICE. As of March 2016.
Source: © 2016 Munich Re, NatCatSERVICE; Property Claim Services (PCS®)*, a Verisk Analytics® business. As of July 2016.
(Based on perils)
Source: © 2016 Munich Re, NatCatSERVICE; Property Claim Services (PCS®)*, a Verisk Analytics® business. As of February 2016.
(Overall and insured losses, 2015 $billions)
Source: © 2016 Munich Re, NatCatSERVICE; Property Claim Services (PCS), a Verisk Analytics business. As of March 2016.
(Overall losses: nominal, inflation adjusted and normalized)
Source: © 2016 Munich Re, NatCatSERVICE; Property Claim Services (PCS), a Verisk Analytics business. As of July 2016.
(Overall losses: nominal, inflationadjusted, and normalized, $billions)
Source: © 2016 Munich Re, NatCatSERVICE; Property Claim Services (PCS®)*, a Verisk Analytics® business. As of July 2016.
(Number of events)
Source: © 2016 Munich Re, NatCatSERVICE. As of March 2016.
(1) Excludes state funds and other residual market insurers.
(2) Adjusted for inflation by ISO using the GDP implicit price deflator.
Source: ISO®, a Verisk Analytics® business.
(1) Excludes state funds and other residual insurers.
Source: ISO®, a Verisk Analytics® business.
(1) Based on states where the National Council on Compensation Insurance provides ratemaking services. Represents costs for injuries that resulted in time off from work. Data for 2014 are preliminary.
Source: U.S. Bureau of Labor Statistics; ©National Council on Compensation Insurance.
($ billions, net premiums written)
Source: SNL Financial LC.
($ billions, net premiums written)
Source: SNL Financial LC.
(1) Long-term bonds with maturity dates over one year, as of December 31, 2014.
Source: SNL Financial LC.
(1) After reinsurance transactions, excludes state funds.
Source: SNL Financial LC.
(1) Cash and invested net admitted assets, as of December 31, 2014.
(2) Includes mortgage loans on real estate.
Source: SNL Financial LC.
($ billions)
(1) After reinsurance transactions, excludes state funds.
(2) Before reinsurance transactions; includes some state funds.
(3) Includes international and miscellaneous coverages.
(4) Includes federally sponsored multiple peril crop and private market crop-hail.
(5) Premiums from certain insurers that write health insurance but file financial statements with state regulators on a property/casualty rather than life/health basis.
(6) Only includes nonproportional reinsurance, an arrangement in which a reinsurer makes payments to an insurer whose losses exceed a predetermined amount.
(7) Coverages protecting against legal liability resulting from negligence, carelessness or failure to act.
Source: SNL Financial LC.
(1) Average annual growth from 1970 through 1993; marks the beginning of the shift to managed care.
(2) Projected.
Source: Centers for Medicare and Medicaid Services, Office of the Actuary.
Source: U.S. Individual Annuity Yearbook - 2014, LIMRA Secure Retirement Institute.
(US$ millions)
(1) Includes life and nonlife insurance premiums.
Source: Insurance Information Institute using data from Swiss Re, sigma, No. 5/2025.
($ trillions, end of year)
(1) Includes defined contribution plans, private defined benefit plans, and state and local and federal pension plans.
Source: Investment Company Institute. 2021. 2021 Investment Company Fact Book: A Review of Trends and Activities in the U.S. Investment Company Industry. Washington, D.C. Investment Company Institute. www.icifactbook.org.
(1) Based on complaints submitted to the Internet Crime Complaint Center.
Source: Internet Crime Complaint Center.
(1) Percentages are based on the total number of Consumer Sentinel Network complaints by calendar year. These figures exclude "Do Not Call" registry complaints.
Source: Federal Trade Commission.
(1) Estimated. Includes FAIR plan and uninsured losses.
Source: ISO®, a Verisk Analytics® business.
(1) Percent of drivers using hand-held cellphones.
Source: U.S. Department of Transportation, National Highway Traffic Safety Administration.
(1) Represents the midpoint jury award. Half of the awards are above the median and half are below.
Source: Reprinted with permission of Thomson Reuters, Current Award Trends in Personal Injury, 54th edition.
($ billions)
(1) Portion of paid claim dollars attributable to fraud or buildup among auto insurance bodily injury coverages: bodily injury, personal injury protection, medical payments, uninsured motorists and underinsured motorists.
Source: Insurance Research Council.
Source: U.S. Department of Labor, Bureau of Labor Statistics.
($ billions)
Source: 2012 to 2014 premiums from Business Insurance (www.businessinsurance.com), August 31, 2015; earlier premiums from other issues.
(Based on perils)
Source: © 2016 Munich Re, NatCatSERVICE; Property Claim Services (PCS®)*, a Verisk Analytics® business. As of July 2016.
(1) Based on net premiums written. Excludes state funds and other residual market carriers.
Source: ISO®, a Verisk Analytics® business.
(2015 $ billions)
Source: © 2016 Munich Re, NatCatSERVICE; Property Claim Services (PCS), a Verisk Analytics business. As of January 2016.
Source: © 2016 Munich Re, NatCatSERVICE; *Property Claim Services (PCS®), a Verisk Analytics® business, **Catastrophe Indices and Quantification Inc. (CatIQ Inc) www.catiq.com. As of July 2016.
(2015 $ billions)
Source: © 2016 Munich Re, NatCatSERVICE, as of January 2016.
Source: © 2017 Munich Re, NatCatSERVICE; *Property Claim Services (PCS®), a Verisk Analytics® business, **Catastrophe Indices and Quantification Inc. (CatIQ Inc) www.catiq.com. As of February 2017.
Source: © 2021 Munich Re, NatCatSERVICE. As of January 2021.
(Percentage distribution)
Source: © 2019 Munich Re, Geo Risks Research, NatCatSERVICE. As of March 2019.
(Percentage distribution)
Source: © 2019 Munich Re, Geo Risks Research, NatCatSERVICE. As of March 2019.
(Percentage distribution)
Source: © 2019 Munich Re, Geo Risks Research, NatCatSERVICE. As of March 2019.
(Percentage distribution)
Source: © 2019 Munich Re, Geo Risks Research, NatCatSERVICE. As of March 2019.
($ millions)
Source: © 2016 Munich Re, Geo Risks Research, NatCatSERVICE. As of January 2016.
Source: © 2021 Munich Re, Geo Risks Research, NatCatSERVICE. As of January 2021.
Source: © 2021 Munich Re, Geo Risks Research, NatCatSERVICE. As of January 2021.
(Overall and insured losses)
Source: © 2016 Munich Re, Geo Risks Research, NatCatSERVICE. As of March 2016.
Source: © 2019 Munich Re, Geo Risks Research, NatCatSERVICE. As of March 2019.
(Number of events)
Source: © 2016 Munich Re, Geo Risks Research, NatCatSERVICE. As of July 2016.
(Percentage distribution)
Source: © 2017 Munich Re, Geo Risks Research, NatCatSERVICE. As of February 2017.
(Percentage distribution)
Source: © 2017 Munich Re, Geo Risks Research, NatCatSERVICE. As of February 2017.
(Percentage distribution)
Source: © 2017 Munich Re, Geo Risks Research, NatCatSERVICE. As of February 2017.
(Percentage distribution)
Source: © 2017 Munich Re, Geo Risks Research, NatCatSERVICE. As of February 2017.
(Number of relevant events by peril)
Source: © 2019 Munich Re, Geo Risks Research, NatCatSERVICE. As of March 2019.
(1) As of September 27, 2016.
Source: Identity Theft Resource Center.
Source: U.S. Bureau of Labor Statistics. https://www.bls.gov/cps/cpsaat11.htm
(Number of relevant events by peril)
Source: © 2019 Munich Re, Geo Risks Research, NatCatSERVICE. As of March 2019.
(Overall and insured losses)
Source: © 2019 Munich Re, Geo Risks Research, NatCatSERVICE. As of March 2019.
(Overall losses: nominal, inflation adjusted, and normalized)
Source: © 2019 Munich Re, Geo Risks Research, NatCatSERVICE. As of March 2019.
(Overall and insured losses)
Source: © 2019 Munich Re, Geo Risks Research, NatCatSERVICE. As of March 2019.
(Overall losses: nominal, inflation adjusted, and normalized)
Source: © 2019 Munich Re, Geo Risks Research, NatCatSERVICE. As of March 2019.
(Insured property losses per state)
Source: © 2019 Munich Re, Geo Risks Research, NatCatSERVICE. As of March 2019.
(Number of relevant events)
Source: © 2016 Munich Re, Geo Risks Research, NatCatSERVICE. As of July 2016.
(Overall and insured losses)
Source: © 2016 Munich Re, Geo Risks Research, NatCatSERVICE. As of July 2016.
(Insured losses)
Source: © 2016 Munich Re, Geo Risks Research, NatCatSERVICE. As of July 2016.
(Overall losses: nominal, inflation adjusted, and normalized)
Source: © 2019 Munich Re, Geo Risks Research, NatCatSERVICE. As of March 2019.
Source: Insurance Institute for Highway Safety.
($ billions)
(1) Excludes state funds.
(2) Net underwriting gain/loss plus net investment income.
Source: NAIC data, sourced from S&P Global Market Intelligence, Insurance Information Institute.
(1) Sum of components may not add to 100 percent due to rounding.
(2) Includes co-payments, deductibles, and any amounts not covered by health insurance.
(3) Department of Veterans Affairs, Department of Defense and Children's Health Insurance Program.
Source: Centers for Medicare and Medicaid Services, Office of the Actuary, National Health Statistics Group.
(1) Excludes Puerto Rico. A tornado that crosses state lines is counted as a single event in this chart.
Source: U.S. Department of Commerce, Storm Prediction Center, National Weather Service.
(US$ billions)
Source: GC Securities, a division of MMC Securities Corp., a registered broker-dealer, member FINRA/SIPC and Guy Carpenter.
Source: U.S. Department of Commerce, National Oceanic and Atmospheric Administration, National Weather Service.
Source: U.S. Bureau of Labor Statistics, Current Population Survey.
Source: U.S. Department of Commerce, National Oceanic and Atmospheric Administration, National Weather Service.
(1) Includes other non-occupants.
Source: U.S. Department of Transportation, National Highway Traffic Safety Administration.
(1) Inhalation and ingestion of food or other object that obstructs breathing.
Source: National Safety Council. (2016). Injury Facts®, 2016 Edition. Itasca, IL.
($ trillions, end of year)
(1) Includes defined contribution plans, private defined benefits plans, state and local and federal pension plans.
Source: 2016 Investment Company Fact Book: A Review of Trends and Activities in the U.S. Investment Company Industry, Investment Company Institute.
($ trillions, year-end)
(1) Estimated.
Source: Investment Company Institute. "The U.S. Retirement Market, First Quarter 2016." www.ici.org.
(2015 $ billions)
(1) Adjusted for inflation through 2015 by ISO using the GDP implicit price deflator. Excludes catastrophes causing direct losses less than $25 million in 1997 dollars. Excludes flood damage covered by the federally administered National Flood Insurance Program.
(2) Includes other wind, hail, and/or flood losses associated with catastrophes involving tornadoes.
(3) Includes wildland fires.
(4) Includes losses from civil disorders, water damage, utility service disruptions, and any workers compensation catastrophes generating losses in excess of PCS's threshold after adjusting for inflation.
Source: Property Claim Services (PCS®), a Verisk Analytics® business.
($ billions, end of year)
(1) Preliminary data. Excludes defined benefit plans.
Source: Investment Company Institute, 2016 Investment Company Fact Book. www.ici.org.
(US$ billions, end of year)
(1) Includes life and nonlife insurance premiums.
Source: Insurance Information Institute using data from Swiss Re, sigma, No. 3/2016.
Source: Board of Governors of the Federal Reserve System, June 9, 2016.
(1) Average annual growth from 1970 through 1993; marks the beginning of the shift to managed care.
(2) Projected.
Source: Centers for Medicare and Medicaid Services, Office of the Actuary.
(Based on first year collected premiums)
(1) Includes brokers, stockbrokers and personal producing general agents.
(2) Includes career, multiline exclusive and home service agents.
(3) No producers are involved. Excludes direct marketing efforts involving agents.
(4) Includes financial institutions, worksite and other channels.
Source: LIMRA’s U.S. Individual Life Insurance Sales Survey and LIMRA estimates.
($ billions, end of year)
(1) Not reported before 2010.
Source: LIMRA Secure Retirement Institute.
($ billions)
(1) Includes variable individual annuities sales which were less than $0.1 billion.
(2) Single premium contracts bought by property/casualty insurers to distribute awards in personal injury or wrongful death lawsuits over a period of time, rather than as lump sums.
Source: LIMRA Secure Retirement Institute.
(Market value, end of year)
(1) Excludes variable annuities.
(2) Includes Keogh accounts.
(3) Includes savings banks, commercial banks and Keogh accounts.
Source: Board of Governors of the Federal Reserve System, June 9, 2016.
(1) Based on plaintiff and defendant verdicts rendered.
Source: Reprinted with permission of Thomson Reuters, Employment Practice Liability: Jury Award Trends And Statistics, 2015 edition.
(Percent change from prior year)
(1) Net premiums written after reinsurance transactions, excludes state funds.
(2) Premiums and annuity considerations (fees for annuity contracts) for life/health insurance companies.
Source: NAIC data, sourced from S&P Global Market Intelligence, Insurance Information Institute.
($ billions)
Source: NAIC data, sourced from S&P Global Market Intelligence, Insurance Information Institute.
($ billions)
(1) Property/casualty: net premiums written after reinsurance transactions, excludes state funds; life/health: premiums, annuity considerations (fees for annuity contracts) and deposit-type funds.
Source: NAIC data, sourced from S&P Global Market Intelligence, Insurance Information Institute.
(1) Long-term bonds with maturity dates over one year, as of December 31, 2015.
Source: NAIC data, sourced from S&P Global Market Intelligence, Insurance Information Institute.
(1) Excludes state funds and other residual market insurers.
(2) Adjusted for inflation by ISO using the GDP implicit price deflator.
Source: ISO®, a Verisk Analytics® business.
(1) Percentages are based on the total number of Consumer Sentinel Network complaints by calendar year. These figures exclude "Do Not Call" registry complaints.
Source: Federal Trade Commission, Consumer Sentinel Network.
Note: Percentages do not add up to 100 percent due to rounding.
Source: U.S. Department of Labor, Bureau of Labor Statistics.
(1) Percentages are dollar-weighted averages.
Source: Investment Company Institute, Holden, Sarah, Jack VanDerhei, Luis Alonso, and Steven Bass. 2017. “401(k) Plan Asset Allocation, Account Balances, and Loan Activity in 2015.” ICI Research Perspective 23, no. 6 (August). www.ici.org/pdf/per23-06.pdf.
(1) Represents the midpoint jury award. Half of the awards are above the median and half are below.
Source: Reprinted with permission of Thomson Reuters, Current Award Trends in Personal Injury, 55th edition.
(1) Percent of drivers using hand-held cellphones.
Source: U.S. Department of Transportation, National Highway Traffic Safety Administration.
($ billions)
(1) Excludes premiums of Lloyd’s of London syndicates.
Source: Business Insurance (www.businessinsurance.com), October 2016.
(1) Cash and invested net admitted assets, as of December 31, 2015.
(2) Includes mortgage loans on real estate.
Source: NAIC data, sourced from S&P Global Market Intelligence, Insurance Information Institute.
(1) Excludes state funds and other residual insurers.
Source: ISO®, a Verisk Analytics® business.
(1) After reinsurance transactions, excludes state funds.
Source: NAIC data, sourced from S&P Global Market Intelligence, Insurance Information Institute.
Source: NAIC data, sourced from S&P Global Market Intelligence, Insurance Information Institute.
($ billions)
Source: NAIC data, sourced from S&P Global Market Intelligence, Insurance Information Institute.
($ billions, net premiums written)
Source: NAIC data, sourced from S&P Global Market Intelligence, Insurance Information Institute.
($ billions)
(1) Excludes state funds.
(2) Net underwriting gain/loss plus net investment income.
Source: NAIC data, sourced from S&P Global Market Intelligence, Insurance Information Institute.
($ billions)
Source: NAIC data, sourced from S&P Global Market Intelligence, Insurance Information Institute.
(1) Based on states where the National Council on Compensation Insurance provides ratemaking services. Represents costs for injuries that resulted in time off from work. Data for 2015 are preliminary.
Source: U.S. Bureau of Labor Statistics; © National Council on Compensation Insurance.
(Weighted average, 2010-2014)
(1) For homeowners multiple peril policies (HO-2, HO-3, HO-5 and HE-7 for North Carolina). Excludes tenants and condominium owners policies. Accident year incurred losses, excluding loss adjustment expenses, i.e., indemnity costs per accident year incurred claims. Excludes Arkansas and Texas.
(2) Includes vandalism and malicious mischief.
(3) Includes coverage for unauthorized use of various cards, forgery, counterfeit money and losses not otherwise classified.
Source: ISO®, a Verisk Analytics® business.
(Weighted average, 2010-2014)
(1) Claims per 100 house years (policies). For homeowners multiple peril policies (HO-2, HO-3, HO-5 and HE-7 for North Carolina). Excludes tenants and condominium owners policies. Excludes Arkansas and Texas.
(2) Includes vandalism and malicious mischief.
(3) Includes coverage for unauthorized use of various cards, forgery, counterfeit money and losses not otherwise classified.
Source: ISO®, a Verisk Analytics® business.
(1) Based on complaints submitted to the Internet Crime Complaint Center.
Source: Internet Crime Complaint Center.
(1) Based on complaints submitted to the Internet Crime Complaint Center.
Source: Internet Crime Complaint Center.
(1) Estimated. Includes FAIR plan and uninsured losses.
Source: ISO®, a Verisk Analytics® business.
(2015 $ millions)
(1) Adjusted for inflation.
Source: © 2016 Munich Re, Geo Risks Research, NatCatSERVICE.
% change from same quarter, prior year
*Commercial property direct premiums written (fire, allied lines, CMP, inland marine, burglary and theft); business fixed investment (structures, equipment, and software).
Note: Recession indicated by gray shaded column. Data are seasonally adjusted annual rates.
Sources: https://fred.stlouisfed.org/series/PNFI#0; National Bureau of Economic Research (recession dates); Insurance Information Institute.
000 at quarter-end
Sources: U.S. Bureau of Labor Statistics; Insurance Information Institute.
*Percentage change from same month in prior year; through February 2018; seasonally adjusted.
Sources: US Bureau of Labor Statistics; National Bureau of Economic Research (recession dates); Insurance Information Institute.
Sources: Federal Highway Administration; Rolling four-quarter average frequency from Fast Track Monitoring System; Insurance Institute for Highway Safety; Insurance Information Institute.
Sources: U.S. Census Bureau at http://www.census.gov/housing/hvs/data/histtabs.html, Table 8; Insurance Information Institute.
Billions, 2017 dollars
*Through third quarter. Adjusted for inflation using the BLS CPI calculator, to 2017 dollars.
Sources: NAIC data, sourced from S&P Global Market Intelligence; Insurance Information Institute.
$ Billions
Data are before taxes and exclude extraordinary items.
Sources: NAIC data, sourced from S&P Global Market Intelligence; Insurance Information Institute.
Sources: ISO/PCI, Insurance Information Institute.
Billions
Through third quarter.
Sources: NAIC data, sourced from S&P Global Market Intelligence; Insurance Information Institute.
Note: Recession indicated by gray shaded column.
Sources: https://fred.stlouisfed.org/series/AAA#0 ; National Bureau of Economic Research (recession dates); Insurance Information Institute.
*Monthly, year-over-year, through February 2018. Seasonally adjusted. **CPI less food and energy.
Sources: US Bureau of Labor Statistics; National Bureau of Economic Research (recession dates); Insurance Information Institute.
Net Premium Growth (All P/C Lines) Minus Nominal GDP, Annual Change
Shaded areas indicate hard markets.
Sources: A.M. Best (1971-2013), ISO (2014-16); U.S. Commerce Dept., Bureau of Economic Analysis; Insurance Information Institute calculations.
This has been a reliable predictor. The last four times ROE fell below 4 percent, a hard market followed. One of those times (2002), a hard market was already under way.
This has not been a reliable predictor. Three times after a decline in surplus, a hard market followed. Three times it did not.
This is the least reliable predictor. Only one year of outsized catastrophe losses (2001) ushered in a hard market.
Source: © 2017 Munich Re, Geo Risks Research, NatCatSERVICE. As of February 2017.
Source: © 2017 Munich Re, NatCatSERVICE; *Property Claim Services (PCS®), a Verisk Analytics® business, **Catastrophe Indices and Quantification Inc. (CatIQ Inc) www.catiq.com. As of February 2017.
(Percentage distribution)
Source: © 2017 Munich Re, Geo Risks Research, NatCatSERVICE. As of February 2017.
(Percentage distribution)
Source: © 2017 Munich Re, Geo Risks Research, NatCatSERVICE. As of February 2017.
(Percentage distribution)
Source: © 2017 Munich Re, Geo Risks Research, NatCatSERVICE. As of February 2017.
(Percentage distribution)
Source: © 2017 Munich Re, Geo Risks Research, NatCatSERVICE. As of February 2017.
Source: © 2017 Munich Re, Geo Risks Research, NatCatSERVICE. As of February 2017.
Source: © 2017 Munich Re, Geo Risks Research, NatCatSERVICE. As of February 2017.
Source: © 2017 Munich Re, Geo Risks Research, NatCatSERVICE. As of February 2017.
Source: © 2017 Munich Re, Geo Risks Research, NatCatSERVICE. As of February 2017.
(Number of relevant events by peril)
Source: © 2017 Munich Re, Geo Risks Research, NatCatSERVICE. As of February 2017.
Source: © 2017 Munich Re, Geo Risks Research, NatCatSERVICE. As of February 2017.
Source: © 2017 Munich Re, Geo Risks Research, NatCatSERVICE. As of February 2017.
(Federal and Foreign Income Tax, Excluding Capital Gains)
$ Billions
Sources: NAIC data, sourced from S&P Global Market Intelligence; I.I.I. calculations.
(Effective Federal and Foreign Income Tax Rates, Excluding Capital Gains)*
*Income taxes as a percent of net income after dividends to policyholders and after capital gains taxes.
Sources: NAIC data, sourced from S&P Global Market Intelligence.
*Projected cumulative profits for 2018-2027 = $22,273.6 billion. Projection = average profits for 2007-2016, growing by assumed nominal GDP growth of 5% per year.
Source of amount of forecast tax changes: Joint Committee on Taxation, JCX-67-17, published December 18, 2017.
*Projected cumulative profits for 2018-2027 = $602.3 billion. Projection = average profits for 2007-2016, growing by assumed nominal GDP growth of 5% per year.
Source of amount of forecast tax changes: Joint Committee on Taxation, JCX-67-17, published December 18, 2017.
*Projected cumulative profits for 2018-2027 = $337.1 billion. Projection = average profits for 2007-2016, growing by assumed nominal GDP growth of 5% per year.
Source of amount of forecast tax changes: Joint Committee on Taxation, JCX-67-17, published December 18, 2017.
% change from same quarter, prior year
*Commercial property direct premiums written (fire, allied lines, CMP, inland marine, burglary and theft); business fixed investment (structures, equipment, and software).
Note: Recession indicated by gray shaded column. Data are seasonally adjusted annual rates.
Sources: https://fred.stlouisfed.org/series/PNFI#0; National Bureau of Economic Research (recession dates); Insurance Information Institute.
000 at quarter-end
Sources: U.S. Department of Commerce, Census Bureau; Insurance Information Institute.
*Percentage change from same month in prior year; through October 2017; seasonally adjusted.
Sources: US Bureau of Labor Statistics; National Bureau of Economic Research (recession dates); Insurance Information Institute.
Sources: Federal Highway Administration; Rolling four-quarter average frequency from Fast Track Monitoring System; Insurance Institute for Highway Safety; Insurance Information Institute.
Sources: U.S. Census Bureau at http://www.census.gov/housing/hvs/data/histtabs.html, Table 8; Insurance Information Institute.
Billions, 2017 dollars
*Through second quarter. Adjusted for inflation using the BLS CPI calculator, to 2017 dollars.
Sources: A.M. Best Special Report, ”A.M. Best First Look – 2Qtr 2017 U.S. Property/Casualty Financial Results”; ISO, a Verisk Analytics company; Insurance Information Institute.
$ Billions
Data are before taxes and exclude extraordinary items.
Sources: NAIC data, sourced from S&P Global Market Intelligence; Insurance Information Institute.
Billions
Through second quarter.
Sources: ISO/PCI; Insurance Information Institute.
Note: Recession indicated by gray shaded column.
Sources: https://fred.stlouisfed.org/series/AAA#0 ; National Bureau of Economic Research (recession dates); Insurance Information Institute.
*Monthly, year-over-year, through October 2017. Seasonally adjusted. **CPI less food and energy.
Sources: US Bureau of Labor Statistics; National Bureau of Economic Research (recession dates); Insurance Information Institute.
(US$ billions)
Source: GC Securities, a division of MMC Securities Corp., a registered broker-dealer, member FINRA/SIPC.
(1) Average annual growth from 1970 through 1993; marks the beginning of the shift to managed care.
(2) Projected.
Source: Centers for Medicare and Medicaid Services, Office of the Actuary.
(millions)
(1) Defined as affected when hailstones are greater than one inch in diameter.
Source: ©2018 Insurance Services Office, Inc. (ISO) and Verisk. Reprinted with permission from ISO. Further reprint prohibited without permission from ISO.
(1) Sum of components may not add to 100 percent due to rounding.
(2) Includes co-payments, deductibles, and any amounts not covered by health insurance.
(3) Department of Veterans Affairs, Department of Defense and Children's Health Insurance Program.
Source: Centers for Medicare and Medicaid Services, Office of the Actuary, National Health Statistics Group.
(Weighted average, 2011-2015)
(1) For homeowners multiple peril policies (HO-2, HO-3, HO-5 and HE-7 for North Carolina). Excludes tenants and condominium owners policies. Accident year incurred losses, excluding loss adjustment expenses, i.e., indemnity costs per accident year incurred claims. Excludes Alaska, Texas and Puerto Rico.
(2) Includes vandalism and malicious mischief.
(3) Includes coverage for unauthorized use of various cards, forgery, counterfeit money and losses not otherwise classified.
Source: ISO®, a Verisk Analytics® business.
(Weighted average, 2011-2015)
(1) Claims per 100 house years (policies). For homeowners multiple peril policies (HO-2, HO-3, HO-5 and HE-7 for North Carolina). Excludes tenants and condominium owners policies. Excludes Alaska, Texas and Puerto Rico.
(2) Includes vandalism and malicious mischief.
(3) Includes coverage for unauthorized use of various cards, forgery, counterfeit money and losses not otherwise classified.
Source: ISO®, a Verisk Analytics® business.
($ billions, end of year)
(1) Preliminary data. Excludes defined benefit plans.
Source: Investment Company Institute. 2017 Investment Company Fact Book: A Review of Trends and Activities in the U.S. Investment Company Industry. www.icifactbook.org.
Source: Insurance Institute for Highway Safety.
(Based on first year collected premiums)
(1) Includes brokers, stockbrokers and personal producing general agents.
(2) Includes career, multiline exclusive and home service agents.
(3) No producers are involved. Excludes direct marketing efforts involving agents.
(4) Includes financial institutions, worksite and other channels.
Source: LIMRA’s U.S. Individual Life Insurance Sales survey results and LIMRA estimates.
(1) As of January 18, 2017.
Source: Identity Theft Resource Center.
(1) Excludes Puerto Rico. A tornado that crosses state lines is counted as a single event in this chart.
Source: U.S. Department of Commerce, Storm Prediction Center, National Weather Service.
(1) Based on complaints submitted to the Internet Crime Complaint Center.
Source: Internet Crime Complaint Center.
($ trillions, end of year)
(1) Includes defined contribution plans, private defined benefits plans, state and local and federal pension plans.
Source: Investment Company Institute. 2017 Investment Company Fact Book: A Review of Trends and Activities in the U.S. Investment Company Industry. www.icifactbook.org.
($ billions, end of year)
(1) Not reported before 2010.
Source: LIMRA Secure Retirement Institute.
($ trillions, end of year)
(1) Includes defined contribution plans, private defined benefits plans, state and local and federal pension plans.
Source: Investment Company Institute. 2017 Investment Company Fact Book: A Review of Trends and Activities in the U.S. Investment Company Industry. www.icifactbook.org.
(1) Includes other non-occupants.
Source: U.S. Department of Transportation, National Highway Traffic Safety Administration.
(US$ millions, end of year)
(1) Includes life and nonlife insurance premiums.
Source: Insurance Information Institute using data from Swiss Re, sigma, No. 3/2017.
(US$ billions)
(1) Before reinsurance transactions.
(2) Includes accident and health insurance.
Source: Swiss Re, sigma, No. 3/2017.
Source: National Council of State Legislatures.
Source: Board of Governors of the Federal Reserve System, June 8, 2017.
(Market value, end of year)
(1) Excludes variable annuities.
(2) Includes Keogh accounts.
(3) Includes savings banks, commercial banks and Keogh accounts.
Source: Board of Governors of the Federal Reserve System, June 8, 2017.
(1) Based on plaintiff and defendant verdicts rendered.
Source: Reprinted with permission of Thomson Reuters, Employment Practice Liability: Jury Award Trends And Statistics, 2016 edition.
(1) Percentages are based on the total number of Consumer Sentinel Network complaints by calendar year. These figures exclude "Do Not Call" registry complaints.
Source: Federal Trade Commission, Consumer Sentinel Network.
($ billions)
Source: NAIC data, sourced from S&P Global Market Intelligence, Insurance Information Institute.
($ billions)
(1) Property/casualty: net premiums written after reinsurance transactions, excludes state funds; life/health: premiums, annuity considerations (fees for annuity contracts) and deposit-type funds.
Source: NAIC data, sourced from S&P Global Market Intelligence, Insurance Information Institute.
(Percent change from prior year)
(1) Net premiums written after reinsurance transactions, excludes state funds.
(2) Premiums and annuity considerations (fees for annuity contracts) for life/health insurance companies.
Source: NAIC data, sourced from S&P Global Market Intelligence, Insurance Information Institute.
($ billions)
(1) Includes variable individual annuities sales which were less than $0.1 billion.
(2) Single premium contracts bought by property/casualty insurers to distribute awards in personal injury or wrongful death lawsuits over a period of time, rather than as lump sums.
Source: LIMRA Secure Retirement Institute.
($ trillions, year-end)
(1) Estimated.
Source: Investment Company Institute. "The U.S. Retirement Market, First Quarter 2017." (June). www.ici.org/research/stats.
(1) Long-term bonds with maturity dates over one year, as of December 31, 2016.
Source: NAIC data, sourced from S&P Global Market Intelligence, Insurance Information Institute.
(1) Percentages are dollar-weighted averages.
Source: Investment Company Institute, Holden, Sarah, Jack VanDerhei, Luis Alonso, and Steven Bass. 2017. “401(k) Plan Asset Allocation, Account Balances, and Loan Activity in 2015.” ICI Research Perspective 23, no. 6 (August). www.ici.org/pdf/per23-06.pdf.
(1) Excludes state funds and other residual market insurers.
(2) Adjusted for inflation by ISO using the GDP implicit price deflator.
Source: ISO®, a Verisk Analytics® business.
(1) Excludes state funds and other residual insurers.
Source: ISO®, a Verisk Analytics® business.
Source: U.S. Department of Commerce, National Oceanic and Atmospheric Administration, National Weather Service.
(1) Based on net premiums written. Excludes state funds and other residual market carriers.
Source: ISO®, a Verisk Analytics® business.
Source: U.S. Individual Annuity Yearbook - 2016, LIMRA Secure Retirement Institute.
(1) Cash and invested net admitted assets, as of December 31, 2016.
(2) Includes mortgage loans on real estate.
Source: NAIC data, sourced from S&P Global Market Intelligence, Insurance Information Institute.
(1) After reinsurance transactions, excludes state funds.
Source: NAIC data, sourced from S&P Global Market Intelligence, Insurance Information Institute.
Note: Percentages do not add up to 100 percent due to rounding.
Source: U.S. Department of Labor, Bureau of Labor Statistics.
($ billions)
(1) Excludes state funds.
(2) Net underwriting gain/loss plus net investment income.
Source: NAIC data, sourced from S&P Global Market Intelligence, Insurance Information Institute.
Source: NAIC data, sourced from S&P Global Market Intelligence, Insurance Information Institute.
(1) Based on states where the National Council on Compensation Insurance provides ratemaking services. Represents costs for injuries that resulted in time off from work. Data for 2016 are preliminary.
Source: U.S. Bureau of Labor Statistics; © National Council on Compensation Insurance.
Source: NAIC data, sourced from S&P Global Market Intelligence, Insurance Information Institute.
($ billions)
Source: NAIC data, sourced from S&P Global Market Intelligence, Insurance Information Institute.
($ billions)
Source: NAIC data, sourced from S&P Global Market Intelligence, Insurance Information Institute.
($ billions)
Source: NAIC data, sourced from S&P Global Market Intelligence, Insurance Information Institute.
(Number of relevant events by peril)
Source: © 2017 Munich Re, Geo Risks Research, NatCatSERVICE. As of January 2017.
(Overall and insured losses)
Source: © 2017 Munich Re, Geo Risks Research, NatCatSERVICE. As of January 2017.
(Overall losses: nominal, inflation adjusted, and normalized)
Source: © 2017 Munich Re, Geo Risks Research, NatCatSERVICE. As of January 2017.
(Overall and insured losses)
Source: © 2017 Munich Re, Geo Risks Research, NatCatSERVICE. As of January 2017.
(Overall losses: nominal, inflation adjusted, and normalized)
Source: © 2017 Munich Re, Geo Risks Research, NatCatSERVICE. As of January 2017.
(Insured property losses per state)
Source: © 2016 Munich Re, Geo Risks Research, NatCatSERVICE. As of July 2016.
(2016 $ millions)
(1) Adjusted for inflation by Munich Re based on the Consumer Price Index.
Source: © 2017 Munich Re, Geo Risks Research, NatCatSERVICE.
(Overall losses: nominal, inflation adjusted, and normalized)
Source: © 2016 Munich Re, Geo Risks Research, NatCatSERVICE. As of July 2016.
(Based on perils)
Source: © 2017 Munich Re, NatCatSERVICE; Property Claim Services (PCS®)*, a Verisk Analytics® business. As of February 2017.
(1) Estimated. Includes FAIR plan and uninsured losses.
Source: ISO®, a Verisk Analytics® business.
(1) Drug poisoning caused by prescription and illegal drugs.
(2) Prescription drugs used to alleviate chronic and acute pain.
Source: Centers for Disease Control and Prevention, National Center for Health Statistics.
(1) Represents the midpoint jury award. Half of the awards are above the median and half are below.
Source: Reprinted with permission of Thomson Reuters, Current Award Trends in Personal Injury, 56th edition.
(1) As of March 28, 2016.
Source: Federal Emergency Management Agency (FEMA).
(1) Drug overdose caused by prescription and illegal drugs.
Source: Centers for Disease Control and Prevention, National Center for Health Statistics.
(Weighted average, 2012-2016)
(1) For homeowners multiple peril policies (HO-2, HO-3, HO-5 and HE-7 for North Carolina). Excludes tenants and condominium owners policies. Accident year incurred losses, excluding loss adjustment expenses, i.e., indemnity costs per accident year incurred claims. Excludes Alaska, Texas and Puerto Rico.
(2) Includes vandalism and malicious mischief.
(3) Includes coverage for unauthorized use of various cards, forgery, counterfeit money and losses not otherwise classified.
Source: ISO®, a Verisk Analytics® business.
(Weighted average, 2012-2016)
(1) Claims per 100 house years (policies). For homeowners multiple peril policies (HO-2, HO-3, HO-5 and HE-7 for North Carolina). Excludes tenants and condominium owners policies. Excludes Alaska, Texas and Puerto Rico.
(2) Includes vandalism and malicious mischief.
(3) Includes coverage for unauthorized use of various cards, forgery, counterfeit money and losses not otherwise classified.
Source: ISO®, a Verisk Analytics® business.
(1) Sum of components may not add to 100 percent due to rounding.
(2) Includes co-payments, deductibles, and any amounts not covered by health insurance.
(3) Department of Veterans Affairs, Department of Defense and Children's Health Insurance Program.
Source: Centers for Medicare and Medicaid Services, Office of the Actuary, National Health Statistics Group.
(1) Percent of drivers using hand held cellphones.
Source: U.S. Department of Transportation, National Highway Traffic Safety Administration.
Source: U.S. Bureau of Labor Statistics, Current Population Survey.
Source: National Interagency Fire Center.
*2018: Inflation-adjusted estimate, subject to change. 2010s is average of 2010 to 2018.
Note: As of Feb. 14, 2019.
Sources: Property Claims Service, a Verisk Analytics business; Insurance Information Institute.
(Based on perils)
Source: © 2018 Munich Re, NatCatSERVICE; Property Claim Services (PCS®)*, a Verisk Analytics® business. As of January 2018.
(Number of relevant events by peril)
Source: © 2018 Munich Re, Geo Risks Research, NatCatSERVICE. As of January 2018.
(Overall and insured losses)
Source: © 2018 Munich Re, Geo Risks Research, NatCatSERVICE. As of January 2018.
(Overall losses: nominal, inflation adjusted, and normalized)
Source: © 2018 Munich Re, Geo Risks Research, NatCatSERVICE. As of January 2018.
(Overall and insured losses)
Source: © 2018 Munich Re, Geo Risks Research, NatCatSERVICE. As of January 2018.
(Overall losses: nominal, inflation adjusted, and normalized)
Source: © 2018 Munich Re, Geo Risks Research, NatCatSERVICE. As of January 2018.
(Insured property losses per state)
Source: © 2018 Munich Re, Geo Risks Research, NatCatSERVICE. As of January 2018.
(Overall losses: nominal, inflation adjusted, and normalized)
Source: © 2018 Munich Re, Geo Risks Research, NatCatSERVICE. As of January 2018.
Source: U.S. Department of Commerce, National Oceanic and Atmospheric Administration, National Weather Service.
Source: Insurance Institute for Highway Safety.
(1) Percentages are based on the total number of Consumer Sentinel Network reports by calendar year. These figures exclude "Do Not Call" registry complaints.
Source: Federal Trade Commission, Consumer Sentinel Network.
Source: © 2018 Munich Re, Geo Risks Research, NatCatSERVICE. As of January 2018.
Source: © 2018 Munich Re, NatCatSERVICE. As of January 2018.
(Percentage distribution)
Source: © 2018 Munich Re, Geo Risks Research, NatCatSERVICE. As of January 2018.
(Percentage distribution)
Source: © 2018 Munich Re, Geo Risks Research, NatCatSERVICE. As of January 2018.
(Percentage distribution)
Source: © 2018 Munich Re, Geo Risks Research, NatCatSERVICE. As of January 2018.
(Percentage distribution)
Source: © 2018 Munich Re, Geo Risks Research, NatCatSERVICE. As of January 2018.
(1) U.S. losses include the loss estimation based on Property Claim Services (PCS).
Source: © 2018 Munich Re, Geo Risks Research, NatCatSERVICE. As of January 2018.
(1) U.S. losses include the loss estimation based on Property Claims Services (PCS).
Source: © 2018 Munich Re, Geo Risks Research, NatCatSERVICE. As of January 2018.
Source: © 2018 Munich Re, Geo Risks Research, NatCatSERVICE. As of January 2018.
Source: © 2018 Munich Re, Geo Risks Research, NatCatSERVICE. As of January 2018.
(Number of relevant events by peril)
Source: © 2018 Munich Re, Geo Risks Research, NatCatSERVICE. As of January 2018.
Source: © 2018 Munich Re, Geo Risks Research, NatCatSERVICE. As of January 2018.
(Number of relevant events by peril)
Source: © 2018 Munich Re, Geo Risks Research, NatCatSERVICE. As of January 2018.
($ billions, end of year)
(1) Preliminary data. Excludes defined benefit plans.
Source: Investment Company Institute. 2018 Investment Company Fact Book: A Review of Trends and Activities in the U.S. Investment Company Industry. www.icifactbook.org.
($ 2015 billions)
(1) Adjusted to 2015 dollars by the Insurance Information Institute using the U.S. Department of Labor BLS Calculator.
(2) Loss total does not include March 2010 New York City settlement of up to $657.5 million to compensate approximately 10,000 Ground Zero workers or any subsequent settlements.
Source: Insurance Information Institute.
(1) Excludes Puerto Rico. A tornado that crosses state lines is counted as a single event in this chart.
Source: U.S. Department of Commerce, Storm Prediction Center, National Weather Service.
Source: U.S. Department of Commerce, National Oceanic and Atmospheric Administration, National Weather Service.
($ billions, end of year)
(1) Not reported before 2010.
Source: U.S. Individual Annuities, 1st Quarter 2018, LIMRA, 2018.
(1) Includes brokers, stockbrokers and personal producing general agents.
(2) Includes career, multiline exclusive and home service agents.
(3) No producers are involved. Excludes direct marketing efforts involving agents.
(4) Includes financial institutions, worksite and other channels.
Source: U.S. Individual Life Insurance Sales Trends, 1975-2017 Estimates, LIMRA, 2018.
Source: U.S. Individual Annuity Yearbook, LIMRA, 2018.
(US$ billions)
Source: GC Securities, a division of MMC Securities Corp., a registered broker-dealer, member FINRA/SIPC, and Guy Carpenter.
($ billions)
(1) Includes variable individual annuities sales which were less than $0.1 billion.
(2) Single premium contracts bought by property/casualty insurers to distribute awards in personal injury or wrongful death lawsuits over a period of time, rather than as lump sums.
Source: U.S. Individual Annuities, 4th Quarter 2017, LIMRA, 2018.
($ trillions, end of year)
(1) Includes defined contribution plans, private defined benefits plans, and state and local and federal pension plans.
Source: Investment Company Institute. 2018 Investment Company Fact Book: A Review of Trends and Activities in the U.S. Investment Company Industry. www.icifactbook.org.
($ trillions, year-end)
(1) Estimated.
Source: Investment Company Institute, "The U.S. Retirement Market, First Quarter 2018." www.ici.org/research/stats.
Source: Board of Governors of the Federal Reserve System, June 8, 2018.
(Market value, end of year)
(1) Excludes variable annuities.
(2) Includes Keogh accounts.
(3) Includes savings banks, commercial banks and Keogh accounts.
Source: Board of Governors of the Federal Reserve System, June 8, 2018.
(US$ billions)
(1) Before reinsurance transactions.
(2) Includes accident and health insurance.
Source: Swiss Re, sigma, No. 3/2018.
(US$ millions, end of year)
(1) Includes life and nonlife insurance premiums.
Source: Insurance Information Institute using data from Swiss Re, sigma, No. 3/2018.
(US$ billions)
(1) Property/casualty: net premiums written after reinsurance transactions, excludes state funds; Life/health: premiums, annuity considerations (fees for annuity contracts) and deposit-type funds.
Source: NAIC data, sourced from S&P Global Market Intelligence, Insurance Information Institute.
($ billions)
Source: NAIC data, sourced from S&P Global Market Intelligence, Insurance Information Institute.
(Percent change from prior year)
(1) Net premiums written after reinsurance transactions, excludes state funds.
(2) Premiums and annuity considerations (fees for annuity contracts) for life/health insurance companies.
Source: NAIC data, sourced from S&P Global Market Intelligence, Insurance Information Institute.
(1) Average annual growth from 1970 through 1993; marks the beginning of the shift to managed care.
(2) Projected.
Source: Centers for Medicare and Medicaid Services, Office of the Actuary.
(1) Long-term bonds with maturity dates over one year, as of December 31, 2017. Excludes investments of separate accounts.
Source: NAIC data, sourced from S&P Global Market Intelligence, Insurance Information Institute.
($ billions)
(1) Excludes state funds.
(2) Net underwriting gain/loss plus net investment income.
Source: NAIC data, sourced from S&P Global Market Intelligence, Insurance Information Institute.
(1) After reinsurance transactions, excludes state funds.
Source: NAIC data, sourced from S&P Global Market Intelligence, Insurance Information Institute.
(1) Excludes state funds and other residual insurers.
Source: ISO®, a Verisk Analytics® business.
(1) Excludes state funds and other residual market insurers.
(2) Adjusted for inflation by ISO using the GDP implicit price deflator.
Source: ISO®, a Verisk Analytics® business.
(1) Cash and invested net admitted assets, as of December 31, 2017.
(2) Includes mortgage loans on real estate.
Source: NAIC data, sourced from S&P Global Market Intelligence, Insurance Information Institute.
(1) Based on direct premiums written. Excludes state funds and other residual market carriers.
Source: NAIC data, sourced from S&P Global Market Intelligence, Insurance Information Institute.
(1) Inhalation and ingestion of food or other object that obstructs breathing.
Source: National Safety Council. Injury Facts®, 2017 Edition. Itasca, IL.
(1) Based on states where the National Council on Compensation Insurance provides ratemaking services. Represents costs for injuries that resulted in time off from work. Data for 2017 are preliminary.
Source: U.S. Bureau of Labor Statistics; ©National Council on Compensation Insurance.
Source: NAIC data, sourced from S&P Global Market Intelligence, Insurance Information Institute.
Source: NAIC data, sourced from S&P Global Market Intelligence, Insurance Information Institute.
($ 2018 billions)
(1) Adjusted to 2018 dollars by the Insurance Information Institute using the U.S. Department of Labor BLS Calculator.
(2) Loss total does not include March 2010 New York City settlement of up to $657.5 million to compensate approximately 10,000 Ground Zero workers or any subsequent settlements.
Source: Insurance Information Institute.
($ billions)
Source: NAIC data, sourced from S&P Global Market Intelligence, Insurance Information Institute.
($ billions)
Source: NAIC data, sourced from S&P Global Market Intelligence, Insurance Information Institute.
(1) Includes other non occupants.
Source: U.S. Department of Transportation, National Highway Traffic Safety Administration.
($ billions)
Source: NAIC data, sourced from S&P Global Market Intelligence, Insurance Information Institute.
(2017 $ millions)
(1) Adjusted for inflation by Munich Re based on the Consumer Price Index.
Source: © 2018 Munich Re, NatCatSERVICE.
(1) Estimated. Includes FAIR plan and uninsured losses.
Source: ISO®, a Verisk Analytics® business.
(1) As of January 22, 2018.
Source: Identity Theft Resource Center.
(1) Based on plaintiff and defendant verdicts rendered.
Source: Reprinted with permission of Thomson Reuters, Employment Practice Liability: Jury Award Trends And Statistics, 2017 edition.
(1) Represents the midpoint jury award. Half of awards are above the median and half are below.
Source: Reprinted with permission of Thomson Reuters, Current Award Trends in Personal Injury, 57th edition.
(1) Includes tenants insurance.
Note: Percentages may not add up to 100 percent due to rounding.
Source: U.S. Department of Labor, Bureau of Labor Statistics.
(1) Percent of all drivers using hand held cellphones.
Source: U.S. Department of Transportation, National Highway Traffic Safety Administration.
(2016 $ billions)
Source: © 2017 Munich Re, Geo Risks Research, NatCatSERVICE. As of February 2017.
(2016 $ billions)
Source: © 2017 Munich Re, Geo Risks Research, NatCatSERVICE. As of February 2017.
(1) Drug overdose caused by prescription and illegal drugs.
Source: Centers for Disease Control and Prevention, National Center for Health Statistics.
Source: © 2019 Munich Re, Geo Risks Research, NatCatSERVICE. As of March 2019.
Source: © 2019 Munich Re, NatCatSERVICE. As of March 2019.
(1) U.S. losses include the loss estimation based on Property Claim Services (PCS).
Source: © 2019 Munich Re, Geo Risks Research, NatCatSERVICE. As of March 2019.
(1) U.S. losses include the loss estimation based on Property Claims Services (PCS).
Source: © 2019 Munich Re, Geo Risks Research, NatCatSERVICE. As of March 2019.
(1) Fatalities for the December 22 volcanic activity and tsunami event in Indonesia are preliminary.
Source: © 2019 Munich Re, Geo Risks Research, NatCatSERVICE. As of March 2019.
(1) Based on complaints submitted to the Internet Crime Complaint Center.
Source: Internet Crime Complaint Center.
(1) As of January 7, 2019.
Source: Identity Theft Resource Center, 2018 End of Year Data Breach Report.
(1) Sum of components may not add to 100 percent due to rounding.
(2) Includes co-payments, deductibles, and any amounts not covered by health insurance.
(3) Department of Veterans Affairs, Department of Defense and Children's Health Insurance Program.
Source: Centers for Medicare and Medicaid Services, Office of the Actuary, National Health Statistics Group.
(1) Short-term and long-term disability.
Source: Eastbridge Consulting Group, Inc.
Source: U.S. Department of Commerce, National Oceanic and Atmospheric Administration, National Weather Service.
Source: U.S. Bureau of Labor Statistics, Current Population Survey.
(1) Average annual growth from 1970 through 1993; marks the beginning of the shift to managed care.
(2) Projected.
Source: Centers for Medicare and Medicaid Services, Office of the Actuary.
* 2004 fires and acres do not include state lands for North Carolina.
Source: National Interagency Fire Center.
(1) Excludes Puerto Rico. A tornado that crosses state lines is counted as a single event in this chart.
Source: U.S. Department of Commerce, Storm Prediction Center, National Weather Service.
(Weighted average, 2013-2017)
(1) Claims per 100 house years (policies). For homeowners multiple peril policies (HO-2, HO-3, HO-5 and HE-7 for North Carolina). Excludes tenants and condominium owners policies. Excludes Alaska,Texas and Puerto Rico.
(2) Includes vandalism and malicious mischief.
(3) Includes coverage for unauthorized use of various cards, forgery, counterfeit money and losses not otherwise classified.
Source: ISO®, a Verisk Analytics® business.
(Weighted average, 2013-2017)
(1) For homeowners multiple peril policies (HO-2, HO-3, HO-5 and HE-7 for North Carolina). Excludes tenants and condominium owners policies. Accident year incurred losses, excluding loss adjustment expenses, i.e., indemnity costs per accident year incurred claims. Excludes Alaska,Texas and Puerto Rico.
(2) Includes vandalism and malicious mischief.
(3) Includes coverage for unauthorized use of various cards, forgery, counterfeit money and losses not otherwise classified.
Source: ISO®, a Verisk Analytics® business.
(1) Percentages are dollar-weighted averages.
Source: Investment Company Institute, Holden, Sarah, Jack VanDerhei, Luis Alonso, and Steven Bass. 2018. “401(k) Plan Asset Allocation, Account Balances, and Loan Activity in 2016.” ICI Research Perspective 24, no. 6 (September). https/www.ici.org/pdf/per/24-06.pdf.
(1) Percentages are based on the total number of Consumer Sentinel Network reports by calendar year. These figures exclude "Do Not Call" registry complaints.
Source: Federal Trade Commission, Consumer Sentinel Network.
| Rank | Group/company | Direct premiums written ($000) | Market share |
|---|---|---|---|
| 1 | Travelers Companies Inc. | $52,130 | 8.9% |
| 2 | Liberty Mutual | 46,180 | 7.9 |
| 3 | Zurich | 37,300 | 6.4 |
| 4 | Nationwide Mutual Group | 28,846 | 4.9 |
| 5 | Chubb | 20,915 | 3.6 |
| 6 | American International Group (AIG) | 18,495 | 3.2 |
| 7 | Mtn W Farm Bureau Mutual Insurance Co. | 17,414 | 3.0 |
| 8 | EMC Insurance | 17,405 | 3.0 |
| 9 | Progressive | 17,279 | 3.0 |
| 10 | Farmers Insurance Group | 15,478 | 2.6 |
Source: Test.
($ millions)
($ billions)
(1) P/C: net premiums written after reinsurance transactions, excludes state funds; life/annuity: premiums, annuity considerations (fees for annuity contracts) and deposit-type funds. Both sectors include accident and health insurance.
Source: NAIC data, sourced from S&P Global Market Intelligence, Insurance Information Institute.
(US$ billions)
(1) Property/casualty: net premiums written after reinsurance transactions, excludes state funds; life/annuity: premiums, annuity considerations (fees for annuity contracts) and deposit-type funds. Both sectors include accident and health insurance.
Source: NAIC data, sourced from S&P Global Market Intelligence, Insurance Information Institute.
(Percent change from prior year)
(1) Net premiums written after reinsurance transactions, excludes state funds, includes accident and health insurance.
(2) Includes premiums, annuity considerations (fees for annuity contracts), deposit-type funds and accident and health insurance.
Source: NAIC data, sourced from S&P Global Market Intelligence, Insurance Information Institute.
(2018 $ billions)
Source: © 2019 Munich Re, Geo Risks Research, NatCatSERVICE. As of November 2019.
(2018 $ billions)
Source: © 2019 Munich Re, Geo Risks Research, NatCatSERVICE. As of November 2019.
(Based on perils)
Source: © 2019 Munich Re, NatCatSERVICE; Property Claim Services (PCS®)*, a Verisk Analytics® business. As of March 2019.
(1) Inhalation and ingestion of food or other object that obstructs breathing.
Source: National Safety Council estimates based on data from National Center for Health Statistics and state vital statistics departments.
Source: U.S. Department of Commerce, National Oceanic and Atmospheric Administration, National Weather Service.
(2018 $ millions)
(1) Adjusted for inflation by Munich Re based on the Consumer Price Index.
Source: © 2019 Munich Re, NatCatSERVICE.
Source: Board of Governors of the Federal Reserve System, June 6, 2019.
(Market value, end of year)
(1) Excludes variable annuities.
(2) Includes Keogh accounts.
(3) Includes savings banks, commercial banks and Keogh accounts.
Source: Board of Governors of the Federal Reserve System, June 6, 2019.
(1) Long-term bonds with maturity dates more than one year, as of December 31, 2018. Does not add to 100 percent due to rounding.
Source: NAIC data, sourced from S&P Global Market Intelligence, Insurance Information Institute.
($ billions)
(1) Excludes state funds.
(2) Net underwriting gain/loss plus net investment income.
Source: NAIC data, sourced from S&P Global Market Intelligence, Insurance Information Institute.
(1) After reinsurance transactions, excludes state funds.
Source: NAIC data, sourced from S&P Global market Intelligence, Insurance Information Institute.
($ billions, end of year)
(1) Not reported before 2010.
Source: U.S. Individual Annuities, 4th Quarter 2018, LIMRA, 2019.
($ billions, end of year)
(1) Preliminary data. Excludes defined benefit plans.
Source: Investment Company Institute. 2019. 2019 Investment Company Fact Book: A Review of Trends and Activities in the U.S. Investment Company Industry. Washington, D.C. Investment Company Institute. www.icifactbook.org.
($ trillions, year-end)
(1) Estimated.
Source: Investment Company Institute. 2019. 2019 Investment Company Fact Book: A Review of Trends and Activities in the U.S. Investment Company Industry. Washington, D.C. Investment Company Institute. www.icifactbook.org.
($ trillions, end of year)
(1) Includes defined contribution plans, private defined benefit plans, and state, local and federal pension plans.
Source: Investment Company Institute. 2019. 2019 Investment Company Fact Book: A Review of Trends and Activities in the U.S. Investment Company Industry. Washington, D.C. Investment Company Institute. www.icifactbook.org.
(1) Includes brokers, broker-dealers, personal producing general agents and registered investment advisers.
(2) Includes agency building, multiline exclusive and home service agents.
(3) No producers are involved. Excludes direct marketing efforts involving agents. Includes internet sales where consumers submit online applications.
(4) Includes financial institutions, worksite and other channels.
Source: U.S. Individual Life Insurance Sales Trends, Industry Estimates, 1975-2018, LIMRA, 2019.
Source: NAIC data, sourced from S&P Global Market Intelligence, Insurance Information Institute.
Source: NAIC data, sourced from S&P Global Market Intelligence, Insurance Information Institute.
($ billions)
(1) Includes variable individual annuities sales which were less than $100 million.
(2) Single premium contracts bought by property/casualty insurers to distribute awards in personal injury or wrongful death lawsuits over a period of time, rather than as lump sums.
Source: U.S. Individual Annuities, 2018 Year in Review, LIMRA, 2019.
(US$ billions)
(1) Before reinsurance transactions.
(2) Includes accident and health insurance.
Source: Swiss Re, sigma, No. 3/2019.
Source: U.S. Individual Annuities, 2018 Year in Review, LIMRA, 2019.
(US$ millions)
(1) Includes life and nonlife insurance premiums.
Source: Insurance Information Institute using data from Swiss Re, sigma, No. 3/2019.
.
Source: Based on data from Investment Company Institute: Holden, Sarah, James Duvall and Elena Barone Chism. 2019. The Economics of Providing 401(k) Plans: Services, Fees and Expenses, 2018. ICI Research Perspective 25, no.4 (July). https://www.ici.org/pdf/per25-04.pdf.
($ billions)
Source: NAIC data, sourced from S&P Global Market Intelligence, Insurance Information Institute.
($ billions)
Source: NAIC data, sourced from S&P Global Market Intelligence, Insurance Information Institute.
($ billions)
Source: NAIC data, sourced from S&P Global Market Intelligence, Insurance Information Institute.
(1) Based on direct premiums written. Excludes state funds and other residual market carriers.
Source: NAIC data, sourced from S&P Global Market Intelligence, Insurance Information Institute.
(1) Based on states where the National Council on Compensation Insurance provides ratemaking services. Represents costs for injuries that resulted in time off from work. Data for 2018 are preliminary.
Source: U.S. Bureau of Labor Statistics; ©National Council on Compensation Insurance.
(1) Cash and invested net admitted assets, as of December 31, 2018.
(2) Includes mortgage loans on real estate.
Source: NAIC data, sourced from S&P Global Market Intelligence, Insurance Information Institute.
(1) Excludes state funds and other residual market insurers.
(2) Adjusted for inflation by ISO using the GDP implicit price deflator.
Source: ISO®, a Verisk Analytics® business.
(1) Estimated. Includes FAIR plan and uninsured losses.
Source: ISO®, a Verisk Analytics® business.
(1) Represents the midpoint jury award. Half of awards are above the median and half are below.
Source: Reprinted with permission of Thomson Reuters, Current Award Trends in Personal Injury, 58th edition.
(1) Includes other non-occupants.
Source: U.S. Department of Transportation, National Highway Traffic Safety Administration.
Source: Insurance Institute for Highway Safety.
(1) Drug overdose caused by prescription and illegal drugs.
Source: Centers for Disease Control and Prevention, National Center for Health Statistics.
(1) Excludes insurance.
Note: Percentages do not add up to 100 percent due to rounding.
Source: U.S. Department of Labor, Bureau of Labor Statistics.
(1) Based on plaintiff and defendant verdicts rendered.
Source: Reprinted with permission of Thomson Reuters, Employment Practice Liability: Jury Award Trends And Statistics, 2018 edition.
(1) Drug overdose caused by prescription and illegal drugs.
Source: Centers for Disease Control and Prevention, National Center for Health Statistics.
Source: © 2020 Munich Re, NatCatSERVICE. As of January 2020.
Source: © 2020 Munich Re, Geo Risks Research, NatCatSERVICE. As of January 2020.
(1) U.S. losses include the loss estimation based on Property Claims Services (PCS).
Source: © 2020 Munich Re, Geo Risks Research, NatCatSERVICE. As of January 2020.
Source: © 2020 Munich Re, Geo Risks Research, NatCatSERVICE. As of January 2020.
(1) Sum of components may not add to 100 percent due to rounding.
(2) Includes co-payments, deductibles, and any amounts not covered by health insurance.
(3) Department of Veterans Affairs, Department of Defense and Children's Health Insurance Program.
Source: Centers for Medicare and Medicaid Services, Office of the Actuary, National Health Statistics Group.
(1) Percentages are based on the total number of Consumer Sentinel Network reports by calendar year. These figures exclude "Do Not Call" registry complaints.
Source: Federal Trade Commission, Consumer Sentinel Network.
*2004 fires and acres do not include state lands for North Carolina.
Source: National Interagency Fire Center.
(1) Inhalation and ingestion of food or other object that obstructs breathing.
Source: National Safety Council estimates based on data from National Center for Health Statistics and state vital statistics departments.
(1) Based on complaints submitted to the Internet Crime Complaint Center.
Source: Internet Crime Complaint Center.
($ billions, end of year)
Source: U.S. Individual Annuities, 4th Quarter 2019, LIMRA, 2020.
Source: U.S. Department of Commerce, National Oceanic and Atmospheric Administration, National Weather Service.
($ trillions, year-end)
(1) Estimated.
Source: Investment Company Institute. 2020. 2020 Investment Company Fact Book: A Review of Trends and Activities in the U.S. Investment Company Industry. Washington, D.C. Investment Company Institute. www.icifactbook.org.
($ trillions, end of year)
(1) Includes defined contribution plans, private defined benefit plans, and state and local and federal pension plans.
Source: Investment Company Institute. 2020. 2020 Investment Company Fact Book: A Review of Trends and Activities in the U.S. Investment Company Industry. Washington, D.C. Investment Company Institute. www.icifactbook.org.
($ billions, end of year)
(1) Preliminary data. Excludes defined benefit plans.
Source: Investment Company Institute. 2020. 2020 Investment Company Fact Book: A Review of Trends and Activities in the U.S. Investment Company Industry. Washington, D.C. Investment Company Institute. www.icifactbook.org.
Source: U.S. Individual Annuities, 2019 Year in Review, LIMRA, 2020.
Source: Insurance Institute for Highway Safety.
(billions)
(1) Property/casualty: net premiums written after reinsurance transactions, excludes state funds; life/annuity: premiums, annuity considerations (fees for annuity contracts) and deposit-type funds. Both sectors include accident and health insurance.
Source: NAIC data, sourced from S&P Global Market Intelligence, Insurance Information Institute.
(Percent change from prior year)
(1) Net premiums written after reinsurance transactions, excludes state funds, includes accident and health insurance.
(2) Includes premiums, annuity considerations (fees for annuity contracts), deposit-type funds and accident and health insurance.
Source: NAIC data, sourced from S&P Global Market Intelligence, Insurance Information Institute.
(1) Based on states where the National Council on Compensation Insurance provides ratemaking services. Represents costs for injuries that resulted in time off from work. Data for 2018 and 2019 are preliminary.
Source: U.S. Bureau of Labor Statistics; ©National Council on Compensation Insurance.
(1) Excludes Puerto Rico. A tornado that crosses state lines is counted as a single event in this chart.
Source: U.S. Department of Commerce, Storm Prediction Center, National Weather Service.
Source: Based on data from Investment Company Institute: Holden, Sarah, James Duvall and Elena Barone Chism. 2020. The Economics of Providing 401(k) Plans: Services, Fees and Expenses, 2019. ICI Research Perspective 25, No. 4 (July 2020). https://www.ici.org/pdf/per26-05.pdf.
(1) Long-term bonds with maturity dates more than one year, as of December 31, 2019. Does not add to 100 percent due to rounding.
Source: NAIC data, sourced from S&P Global Market Intelligence, Insurance Information Institute.
($ billions)
(1) Excludes state funds.
(2) Net underwriting gain/loss plus net investment income.
Source: NAIC data, sourced from S&P Global Market Intelligence, Insurance Information Institute.
(1) After reinsurance transactions, excludes state funds.
Source: NAIC data, sourced from S&P Global market Intelligence, Insurance Information Institute.
(1) Cash and invested net admitted assets, as of December 31, 2019.
(2) Includes mortgage loans on real estate.
*Bonds represents 57.05% of total investments.
Source: NAIC data, sourced from S&P Global Market Intelligence, Insurance Information Institute.
Source: NAIC data, sourced from S&P Global Market Intelligence, Insurance Information Institute.
Source: NAIC data, sourced from S&P Global Market Intelligence, Insurance Information Institute.
($ billions)
Source: NAIC data, sourced from S&P Global Market Intelligence, Insurance Information Institute.
($ billions)
Source: NAIC data, sourced from S&P Global Market Intelligence, Insurance Information Institute.
(1) Excludes state funds and other residual market insurers.
(2) Adjusted for inflation by ISO using the GDP implicit price deflator.
Source: ISO®, a Verisk Analytics® business.
(1) Excludes state funds and other residual insurers.
Source: ISO©, a Verisk Analytics© company.
(Weighted average, 2014-2018)
(1) For homeowners multiple peril policies (HO-2, HO-3, HO-5 and HE-7 for North Carolina). Excludes tenants and condominium owners policies. Accident year incurred losses, excluding loss adjustment expenses, i.e., indemnity costs per accident year incurred claims. Excludes Alaska,Texas and Puerto Rico.
(2) Includes coverage for unauthorized use of various cards, forgery, counterfeit money and losses not otherwise classified.
(3) Includes vandalism and malicious mischief.
Source: ISO®, a Verisk Analytics® business.
(Weighted average, 2014-2018)
(1) Claims per 100 house years (policies). For homeowners multiple peril policies (HO-2, HO-3, HO-5 and HE-7 for North Carolina). Excludes tenants and condominium owners policies. Excludes Alaska,Texas and Puerto Rico.
(2) Includes vandalism and malicious mischief.
(3) Includes coverage for unauthorized use of various cards, forgery, counterfeit money and losses not otherwise classified.
Source: ISO®, a Verisk Analytics® business.
(1) Based on direct premiums written. Excludes state funds and other residual market carriers.
Source: NAIC data, sourced from S&P Global Market Intelligence, Insurance Information Institute.
Source: Identity Theft Resource Center, 2019 End of Year Data Breach Report.
Source: Board of Governors of the Federal Reserve System, June 11, 2020.
($ billions)
(1) P/C: net premiums written after reinsurance transactions, excludes state funds; life/annuity: premiums, annuity considerations (fees for annuity contracts) and deposit-type funds. Both sectors include accident and health insurance.
Source: NAIC data, sourced from S&P Global Market Intelligence, Insurance Information Institute.
(1) Represents the midpoint jury award. Half of awards are above the median and half are below.
Source: Reprinted with permission of Thomson Reuters, Current Award Trends in Personal Injury, 59th edition.
(1) Includes other non-occupants.
Source: U.S. Department of Transportation, National Highway Traffic Safety Administration.
(US$ billions)
(1) Before reinsurance transactions.
(2) Includes accident and health insurance.
Source: Swiss Re, sigma, No. 4/2020.
Note: Percentages do not add up to 100 percent due to rounding.
(1) Excludes insurance.
Source: U.S. Department of Labor, Bureau of Labor Statistics.
(US$ millions)
(1) Includes life and nonlife insurance premiums.
Source: Insurance Information Institute using data from Swiss Re, sigma, No. 4/2020.
.
(1) Percent of all drivers using handheld cellphones.
Source: U.S. Department of Transportation, National Highway Traffic Safety Administration.
(1) Includes brokers, broker-dealers, personal producing general agents and registered investment advisers.
(2) Includes agency building, multiline exclusive and home service agents.
(3) No producers are involved. Excludes direct marketing efforts involving agents. Includes internet sales where consumers submit online applications.
(4) Includes financial institutions, worksite and other channels.
Source: U.S. Individual Life Insurance Sales Trends, Industry Estimates, 1975-2019, LIMRA, 2020.
($ billions)
(1) Includes variable individual annuities sales which were less than $0.1 billion.
(2) Single premium contracts bought by property/casualty insurers to distribute awards in personal injury or wrongful death lawsuits over a period of time, rather than as lump sums.
Source: U.S. Individual Annuities, 2019 Year in Review, LIMRA, 2020.
($ billions)
Source: NAIC data, sourced from S&P Global Market Intelligence, Insurance Information Institute.
(Market value, end of year)
(1) Excludes variable annuities.
(2) Includes Keogh accounts.
(3) Includes savings banks, commercial banks and Keogh accounts.
Source: Board of Governors of the Federal Reserve System, June 11, 2020.
(1) Estimated. Includes FAIR plan and uninsured losses.
Source: ISO®, a Verisk Analytics® business.
($ 2019 billions)
(1) Adjusted to 2019 dollars by the Insurance Information Institute using the U.S. Department of Labor BLS Calculator.
(2) Loss total does not include March 2010 New York City settlement of up to $657.5 million to compensate approximately 10,000 Ground Zero workers or any subsequent settlements.
Source: Insurance Information Institute.
Source: U.S. Department of Commerce, National Oceanic and Atmospheric Administration, National Weather Service.
(1) Includes brokers, broker-dealers, personal producing general agents and registered investment advisers.
(2) Includes agency building, multiline exclusive and home service agents.
(3) No producers are involved. Excludes direct marketing efforts involving agents. Includes internet sales where consumers submit online applications.
(4) Includes financial institutions, worksite and other channels.
Source: U.S. Individual Life Insurance Sales Trends, Industry Estimates, 1975-2020, LIMRA, 2021.
(1) Based on plaintiff and defendant verdicts rendered.
Source: Reprinted with permission of Thomson Reuters, Employment Practice Liability: Jury Award Trends And Statistics, 2020 edition.
Source: U.S. Bureau of Labor Statistics, Current Population Survey.
(1) Short-term and long-term disability.
Source: Eastbridge Consulting Group, Inc.
(1) Drug overdose caused by prescription and illegal drugs.
Source: Centers for Disease Control and Prevention, National Center for Health Statistics.
Source: Identity Theft Resource Center, 2020 year in review, Data Breach Report.
(1) Inhalation and ingestion of food or other object that obstructs breathing.
Source: National Safety Council estimates based on data from National Center for Health Statistics and state vital statistics departments.
*2004 fires and acres do not include state lands for North Carolina.
Source: National Interagency Fire Center.
Source: U.S. Department of Commerce, National Oceanic and Atmospheric Administration, National Weather Service.
(1) Excludes Puerto Rico. A tornado that crosses state lines is counted as a single event in this chart.
Source: U.S. Department of Commerce, Storm Prediction Center, National Weather Service.
Source: U.S. Bureau of Labor Statistics, Current Population Survey.
($ billions, end of year)
Source: U.S. Individual Annuities, 4th Quarter 2020, LIMRA, 2021.
(1) Percentages are based on the total number of Consumer Sentinel Network reports by calendar year. These figures exclude "Do Not Call" registry complaints.
Source: Federal Trade Commission, Consumer Sentinel Network.
(Weighted average, 2015-2019)
(1) For homeowners multiple peril policies (HO-2, HO-3, HO-5 and HE-7 for North Carolina). Excludes tenants and condominium owners policies. Accident year incurred losses, excluding loss adjustment expenses, i.e., indemnity costs per accident year incurred claims. Excludes Alaska, Texas and Puerto Rico.
(2) Includes vandalism and malicious mischief.
(3) Includes coverage for unauthorized use of various cards, forgery, counterfeit money and losses not otherwise classified. This figure is significantly lower than previous five-year results due to a change in the companies surveyed to produce the data.
Source: ISO®, a Verisk Analytics® business.
(Weighted average, 2015-2019)
(1) Claims per 100 house years (policies). One house-year represents policy coverage on a dwelling for 12 months. For homeowners multiple peril policies (HO-2, HO-3, HO-5 and HE-7 for North Carolina). Excludes tenants and condominium owners policies. Excludes Alaska, Texas and Puerto Rico.
(2) Includes vandalism and malicious mischief.
(3) Includes coverage for unauthorized use of various cards, forgery, counterfeit money and losses not otherwise classified.
Source: ISO®, a Verisk Analytics® business.
(1) Represents the midpoint jury award. Half of awards are above the median and half are below.
Source: Reprinted with permission of Thomson Reuters, Current Award Trends in Personal Injury, 60th edition.
Source: NAIC data, sourced from S&P Global Market Intelligence, Insurance Information Institute.
(1) Based on states where the National Council on Compensation Insurance provides ratemaking services. Represents costs for injuries that resulted in time off from work. Data for 2020 are preliminary. Excludes COVID-19 claims.
Source: U.S. Bureau of Labor Statistics; ©National Council on Compensation Insurance.
Source: NAIC data, sourced from S&P Global Market Intelligence, Insurance Information Institute.
($ billions)
Source: NAIC data, sourced from S&P Global Market Intelligence, Insurance Information Institute.
($ billions)
Source: NAIC data, sourced from S&P Global Market Intelligence, Insurance Information Institute.
Source: Insurance Institute for Highway Safety.
(1) Includes brokers, broker-dealers, personal producing general agents and registered investment advisers.
(2) Includes agency building, multiline exclusive and home service agents.
(3) No producers are involved. Excludes direct marketing efforts involving agents. Includes internet sales where consumers submit online applications.
(4) Includes financial institutions, worksite and other channels.
Source: U.S. Individual Life Insurance Sales Trends, Industry Estimates, 1975-2020, LIMRA, 2021.
(1) Long-term bonds with maturity dates over one year, as of December 31, 2020.
Source: NAIC data, sourced from S&P Global Market Intelligence, Insurance Information Institute.
(1) Based on direct premiums written. Excludes state funds and other residual market carriers.
Source: NAIC data, sourced from S&P Global Market Intelligence, Insurance Information Institute.
(1) Includes other non-occupants.
Source: U.S. Department of Transportation, National Highway Traffic Safety Administration.
($ billions)
(1) Excludes state funds.
(2) Net underwriting gain/loss plus net investment income.
Source: NAIC data, sourced from S&P Global Market Intelligence, Insurance Information Institute.
(US$ billions)
(1) Before reinsurance transactions.
(2) Includes accident and health insurance.
Source: Swiss Re, sigma, 3/2021.
(Percent change from prior year)
(1) Net premiums written after reinsurance transactions, excludes state funds, includes accident and health insurance.
(2) Includes premiums, annuity considerations (fees for annuity contracts), deposit-type funds and accident and health insurance.
Source: NAIC data, sourced from S&P Global Market Intelligence, Insurance Information Institute.
($ billions)
(1) P/C: net premiums written after reinsurance transactions, excludes state funds; life/annuity: premiums, annuity considerations (fees for annuity contracts) and deposit-type funds. Both sectors include accident and health insurance.
Source: NAIC data, sourced from S&P Global Market Intelligence, Insurance Information Institute.
($ billions)
(1) Property/casualty: net premiums written after reinsurance transactions, excludes state funds; life/annuity: premiums, annuity considerations (fees for annuity contracts) and deposit-type funds. Both sectors include accident and health insurance.
Source: NAIC data, sourced from S&P Global Market Intelligence, Insurance Information Institute.
(US$ millions)
(1) Includes life and nonlife insurance premiums.
Source: Insurance Information Institute using data from Swiss Re, sigma, No. 3/2021.
(US$ millions)
(1) Includes life and nonlife insurance premiums.
Source: Insurance Information Institute using data from Swiss Re, sigma, No. 3/2021.
(1) Cash and invested net admitted assets, as of December 31, 2020.
(2) Includes mortgage loans on real estate.
*Bonds represents 55.38% of total investments.
Source: NAIC data, sourced from S&P Global Market Intelligence, Insurance Information Institute.
($ billions)
(1) Single premium contracts bought by property/casualty insurers to distribute awards in personal injury or wrongful death lawsuits over a period of time, rather than as lump sums.
Source: U.S. Individual Annuities, 2020 Year in Review, LIMRA, 2021.
Source: U.S. Individual Annuities, 2020 Year in Review, LIMRA, 2021.
(1) Short-term and long-term disability.
Source: Eastbridge Consulting Group, Inc.
Source: NAIC data, sourced from S&P Global Market Intelligence; Insurance Information Institute.
($ billions)
Source: NAIC data, sourced from S&P Global Market Intelligence, Insurance Information Institute.
(1) Adjusted for inflation by the Insurance Information Institute using the GDP implicit price deflator.
Source: NAIC data, sourced from S&P Global Market Intelligence; Insurance Information Institute.
(1) After reinsurance transactions, excludes state funds.
Source: NAIC data, sourced from S&P Global market Intelligence, Insurance Information Institute.
Note: Percentages do not add up to 100 percent due to rounding.
(1) Excludes insurance.
Source: U.S. Department of Labor, Bureau of Labor Statistics.
(1) Estimated. Includes FAIR plan and uninsured losses.
Source: ISO®, a Verisk Analytics® business.
(1) Percent of all drivers using hand held cellphones.
Source: U.S. Department of Transportation, National Highway Traffic Safety Administration.
(1) Less than 1 percent.
Source: © AM Best - used with permission.
(1) Based on plaintiff and defendant verdicts rendered.
Source: Reprinted with permission of Thomson Reuters, Employment Practice Liability: Jury Award Trends And Statistics, 2021 edition.
Source: U.S. Department of Commerce, National Oceanic and Atmospheric Administration, National Weather Service.
(1) Percentages are based on the total number of Consumer Sentinel Network reports by calendar year. These figures exclude "Do Not Call" registry complaints.
Source: Federal Trade Commission, Consumer Sentinel Network.
Source: U.S. Individual Annuities, GLIMPSE Quarterly Reports, LIMRA Secure Retirement Institute.
Source: U.S. Individual Annuities, GLIMPSE Quarterly Reports, LIMRA Secure Retirement Institute.
Source: U.S. Department of Commerce, National Oceanic and Atmospheric Administration, National Weather Service.
(1) Cash and invested net admitted assets, as of December 31, 2021.
(2) Includes mortgage loans on real estate.
*Bonds represents 53.02% of total investments.
Source: NAIC data, sourced from S&P Global Market Intelligence, Insurance Information Institute.
(US$ billions)
(1) Property/casualty: net premiums written after reinsurance transactions, excludes state funds; life/annuity: premiums, annuity considerations (fees for annuity contracts) and deposit-type funds. Both sectors include accident and health insurance.
Source: NAIC data, sourced from S&P Global Market Intelligence, Insurance Information Institute.
($ billions)
Source: NAIC data, sourced from S&P Global Market Intelligence, Insurance Information Institute.
($ billions)
Source: NAIC data, sourced from S&P Global Market Intelligence, Insurance Information Institute.
($ billions)
Source: NAIC data, sourced from S&P Global Market Intelligence, Insurance Information Institute.
(US$ millions)
(1) Includes life and nonlife insurance premiums.
Source: Insurance Information Institute using data from Swiss Re, sigma, No. 4/2022.
(US$ billions)
(1) Before reinsurance transactions.
(2) Includes accident and health insurance.
Source: Swiss Re, sigma, 4/2022.
Note: Percentages do not add up to 100 percent due to rounding.
(1) Excludes insurance.
Source: U.S. Department of Labor, Bureau of Labor Statistics.
(1) Less than 1 percent.
Source: © AM Best - used with permission.
*2004 fires and acres do not include state lands for North Carolina.
Source: National Interagency Fire Center.
(1) Percent of all drivers using hand held cellphones.
Source: U.S. Department of Transportation, National Highway Traffic Safety Administration.
Source: U.S. Department of Commerce, National Oceanic and Atmospheric Administration, National Weather Service.
(1) Percentages are based on the total number of Consumer Sentinel Network reports by calendar year. These figures exclude "Do Not Call" registry complaints.
Source: Federal Trade Commission, Consumer Sentinel Network.
($ 2021 billions)
(1) Adjusted to 2021 dollars by the Insurance Information Institute using the U.S. Department of Labor BLS Calculator.
(2) Loss total does not include March 2010 New York City settlement of up to $657.5 million to compensate approximately 10,000 Ground Zero workers or any subsequent settlements.
Source: Insurance Information Institute.
Source: U.S. Individual Annuities, GLIMPSE Quarterly Reports, LIMRA Secure Retirement Institute.
(US$ billions)
(1) Property/casualty: net premiums written after reinsurance transactions, excludes state funds; life/annuity: premiums, annuity considerations (fees for annuity contracts) and deposit-type funds. Both sectors include accident and health insurance.
Source: NAIC data, sourced from S&P Global Market Intelligence, Insurance Information Institute.
($ billions)
(1) P/C: net premiums written after reinsurance transactions, excludes state funds; life/annuity: premiums, annuity considerations (fees for annuity contracts) and deposit-type funds. Both sectors include accident and health insurance.
Source: NAIC data, sourced from S&P Global Market Intelligence, Insurance Information Institute.
Source: U.S. Department of Commerce, National Oceanic and Atmospheric Administration, National Weather Service.
($ billions)
Source: NAIC data, sourced from S&P Global Market Intelligence, Insurance Information Institute.
($ billions)
Source: NAIC data, sourced from S&P Global Market Intelligence, Insurance Information Institute.
(1) Cash and invested net admitted assets, as of December 31, 2022.
(2) Includes mortgage loans on real estate.
*Bonds represents 55.31% of total investments.
Source: NAIC data, sourced from S&P Global Market Intelligence, Insurance Information Institute.
($ billions)
Source: NAIC data, sourced from S&P Global Market Intelligence, Insurance Information Institute.
(US$ millions)
(1) Includes life and nonlife insurance premiums.
Source: Insurance Information Institute using data from Swiss Re, sigma, No. 3/2023.
(US$ billions)
(1) Before reinsurance transactions.
(2) Includes accident and health insurance.
Source: Swiss Re, sigma, 3/2023.
*2004 fires and acres do not include state lands for North Carolina.
Source: National Interagency Fire Center.
Source: U.S. Department of Commerce, National Oceanic and Atmospheric Administration, National Weather Service.
(1) Percent of all drivers using hand held cellphones.
Source: U.S. Department of Transportation, National Highway Traffic Safety Administration.
(1) Percentages are based on the total number of Consumer Sentinel Network reports by calendar year. These figures exclude "Do Not Call" registry complaints.
Source: Federal Trade Commission, Consumer Sentinel Network.
Source: U.S. Individual Annuities, GLIMPSE Quarterly Reports, LIMRA Secure Retirement Institute.
Source: U.S. Department of Commerce, National Oceanic and Atmospheric Administration, National Weather Service.
(1) Cash and invested net admitted assets, as of December 31, 2023.
(2) Bonds represents 54.5% of total investments.
(3) Includes mortgage loans on real estate.
Source: NAIC data, sourced from S&P Global Market Intelligence, Insurance Information Institute.
($ billions)
(1) P/C: net premiums written after reinsurance transactions, excludes state funds; life/annuity: premiums, annuity considerations (fees for annuity contracts) and deposit-type funds. Both sectors include accident and health insurance.
Source: NAIC data, sourced from S&P Global Market Intelligence, Insurance Information Institute.
(US$ billions)
(1) Property/casualty: net premiums written after reinsurance transactions, excludes state funds; life/annuity: premiums, annuity considerations (fees for annuity contracts) and deposit-type funds. Both sectors include accident and health insurance.
Source: NAIC data, sourced from S&P Global Market Intelligence, Insurance Information Institute.
($ billions)
Source: NAIC data, sourced from S&P Global Market Intelligence, Insurance Information Institute.
($ billions)
Source: NAIC data, sourced from S&P Global Market Intelligence, Insurance Information Institute.
($ billions)
Source: NAIC data, sourced from S&P Global Market Intelligence, Insurance Information Institute.
*2004 fires and acres do not include state lands for North Carolina.
Source: National Interagency Fire Center.
Source: U.S. Department of Commerce, National Oceanic and Atmospheric Administration, National Weather Service.
Note: Percentages do not add up to 100 percent due to rounding.
(1) Excludes insurance.
Source: U.S. Department of Labor, Bureau of Labor Statistics.
Source: U.S. Department of Commerce, National Oceanic and Atmospheric Administration, National Weather Service and National Lightning Safety Council.
(US$ millions)
(1) Includes life and nonlife insurance premiums.
Source: Insurance Information Institute using data from Swiss Re, sigma, No. 3/2024.
(US$ billions)
(1) Before reinsurance transactions.
(2) Includes accident and health insurance.
Source: Swiss Re Institute, sigma, 3/2024.
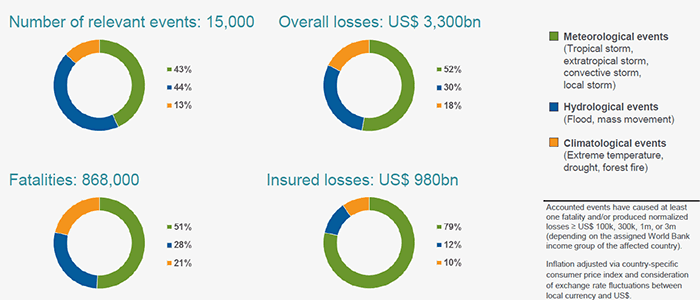


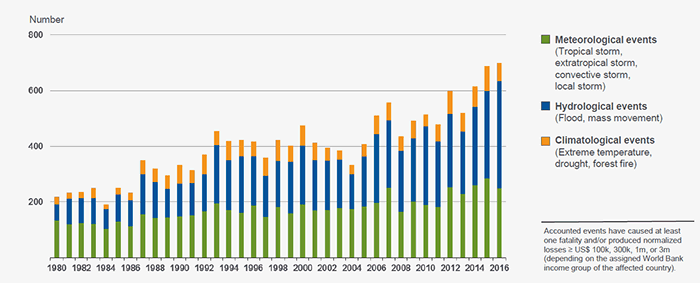


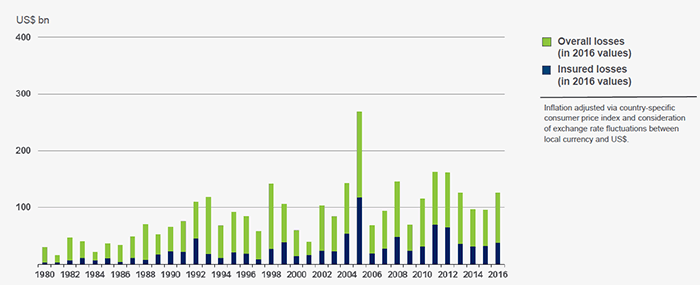


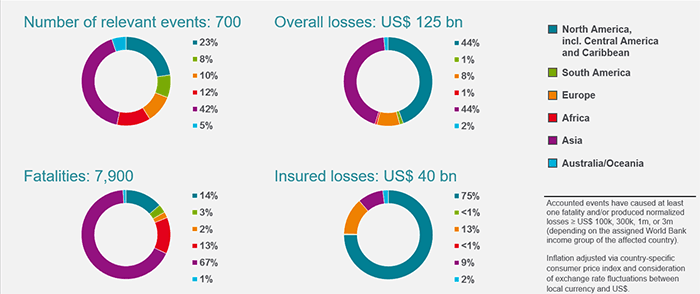
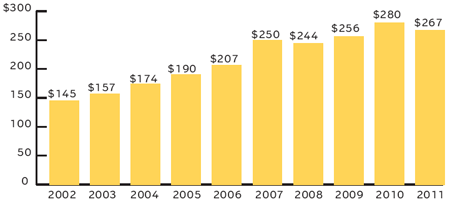
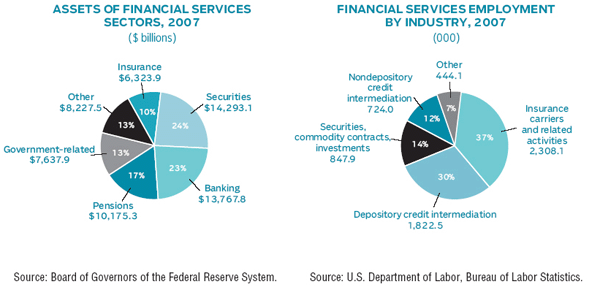
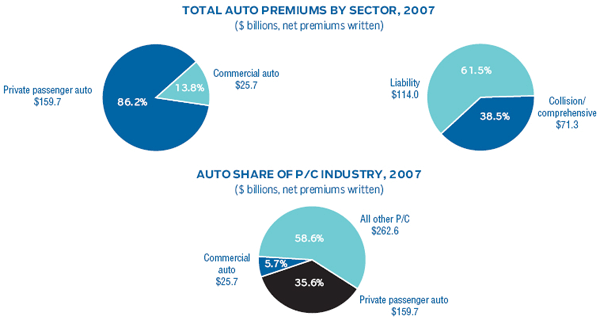
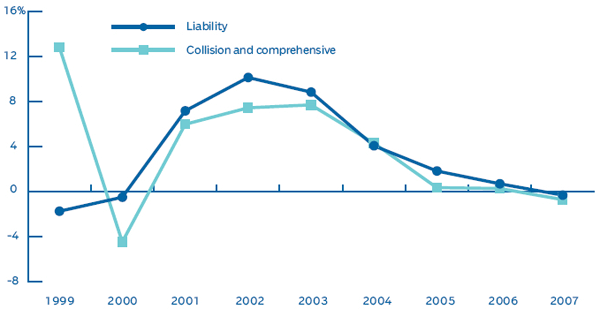

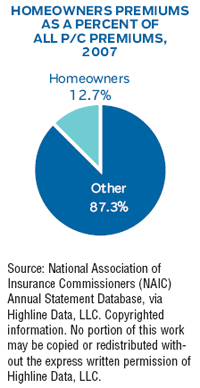
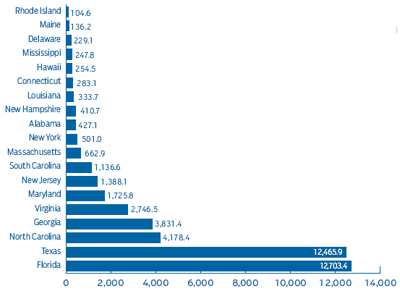
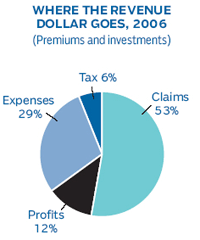
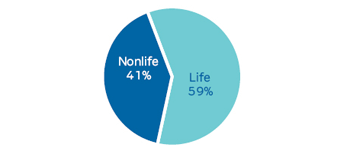
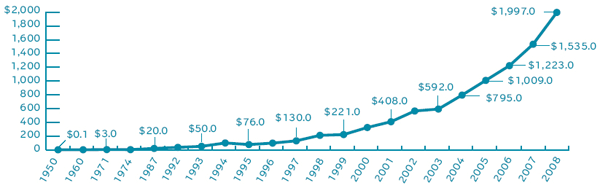
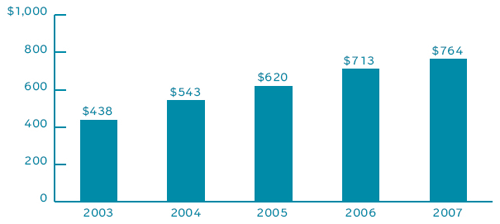
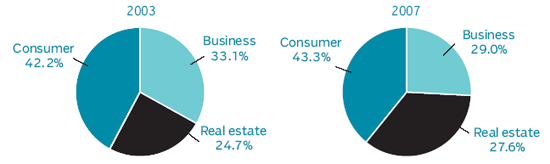
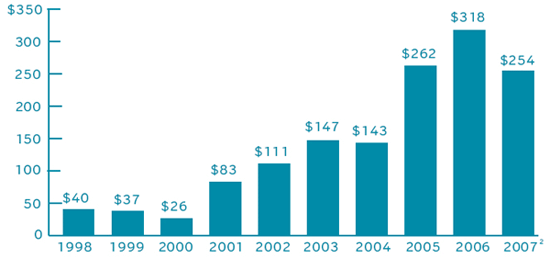
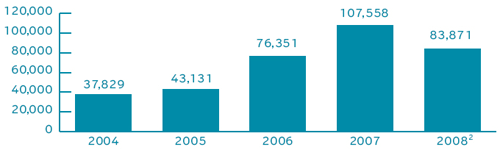
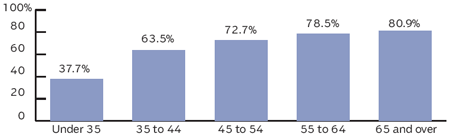
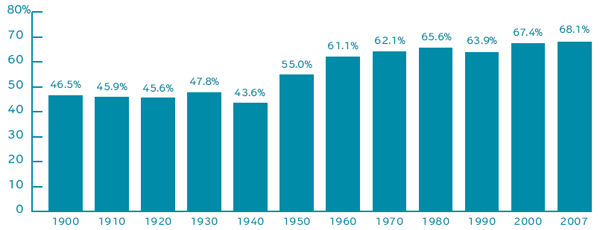
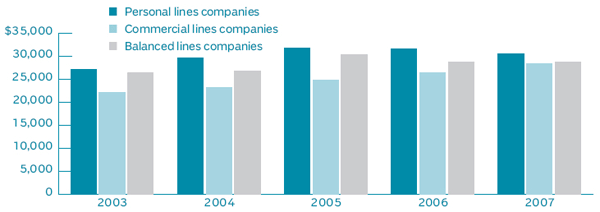
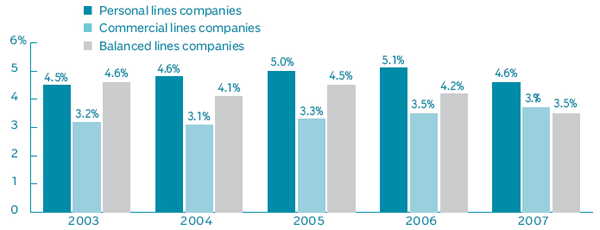
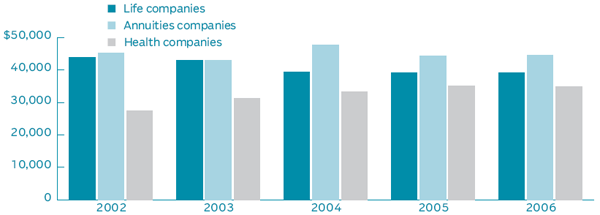
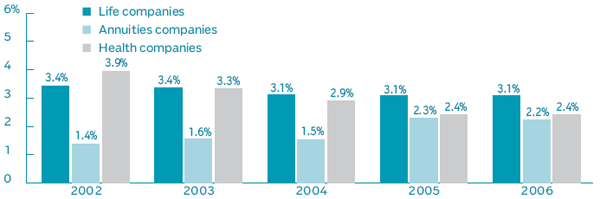
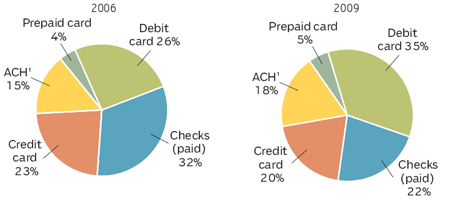
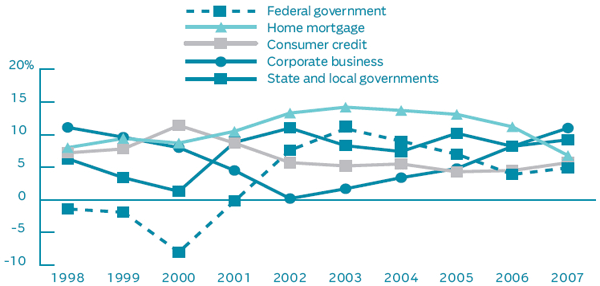
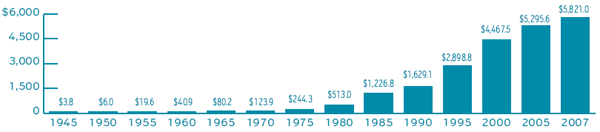
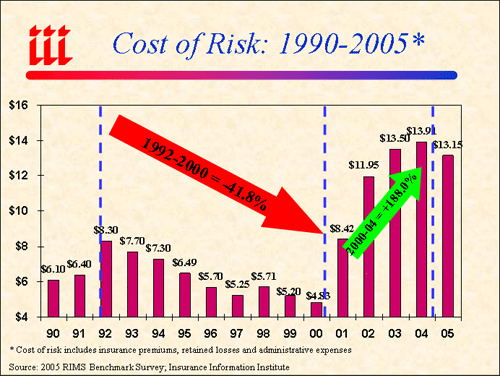
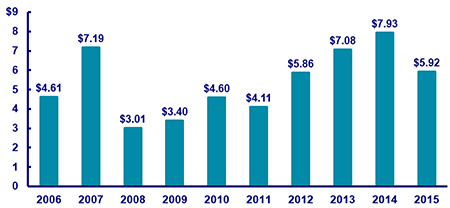
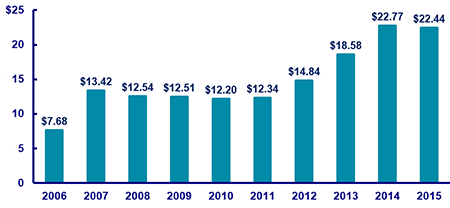
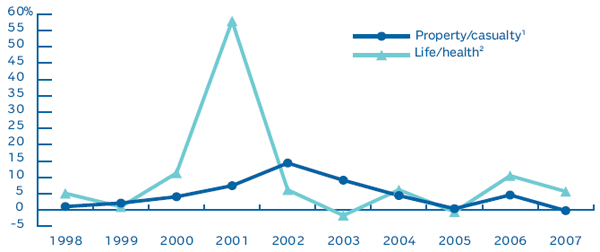

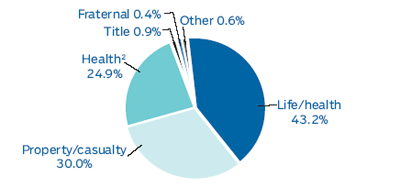
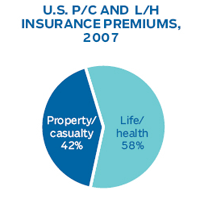

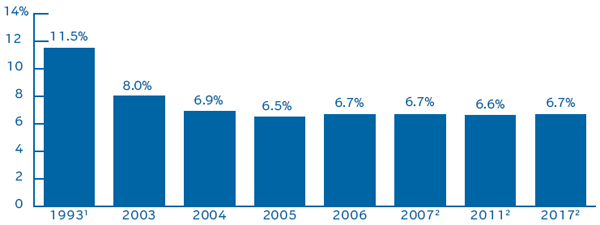
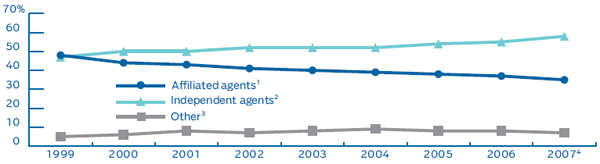
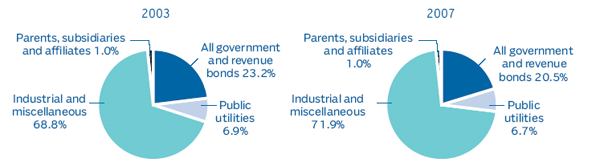
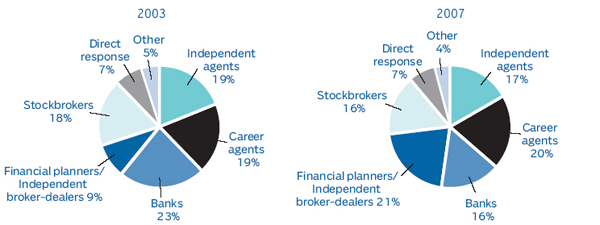
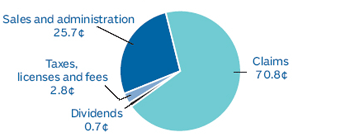
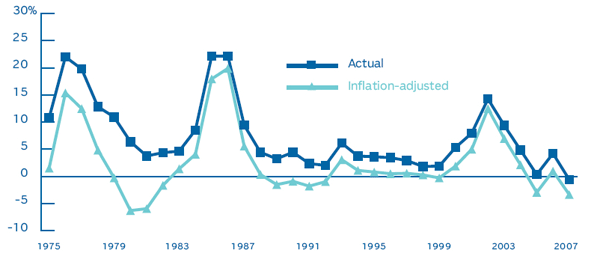
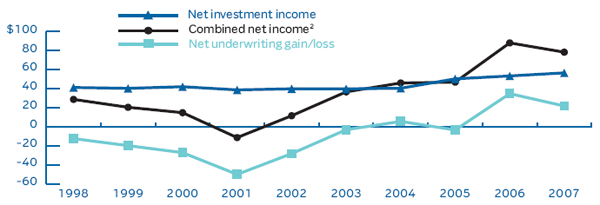
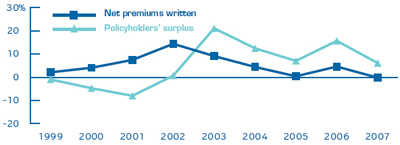
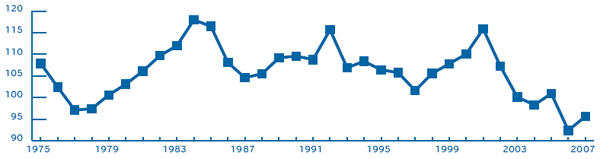
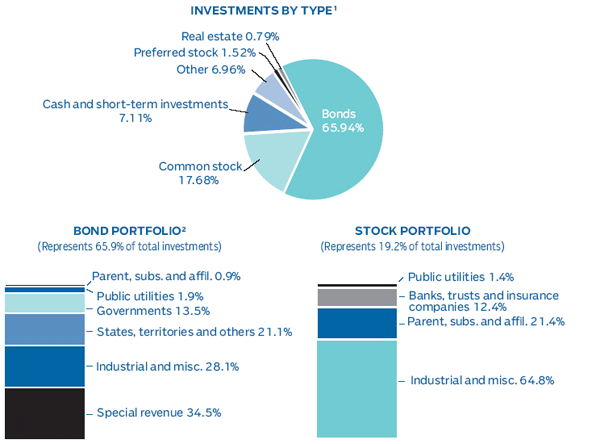
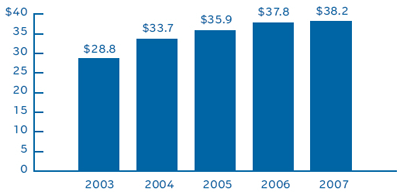
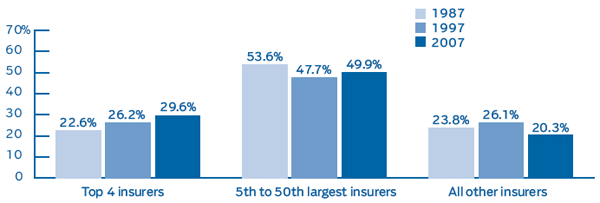
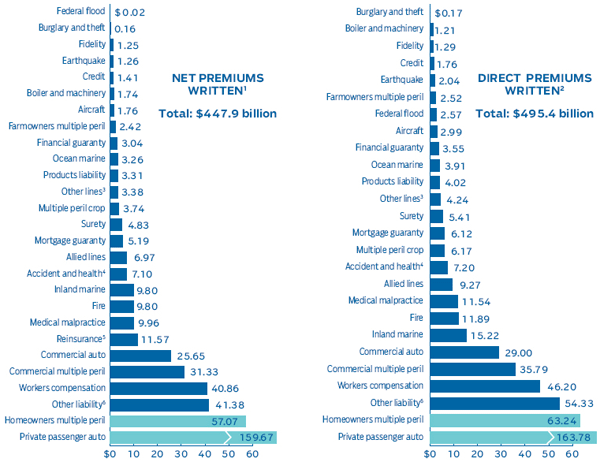
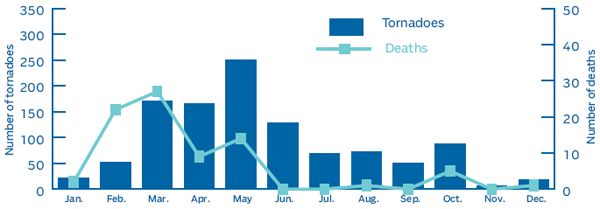
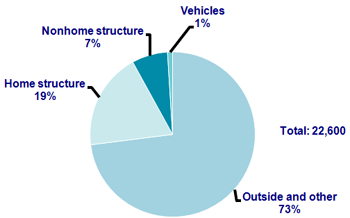
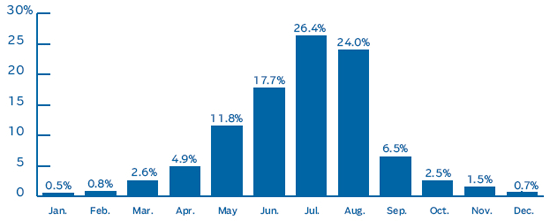
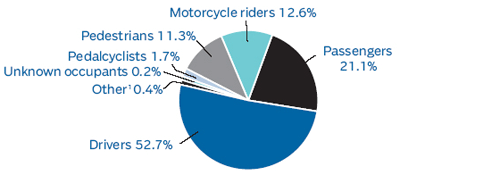
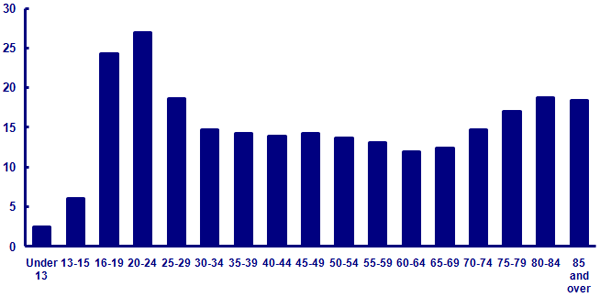
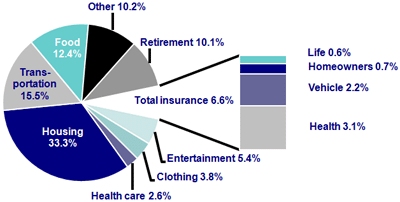
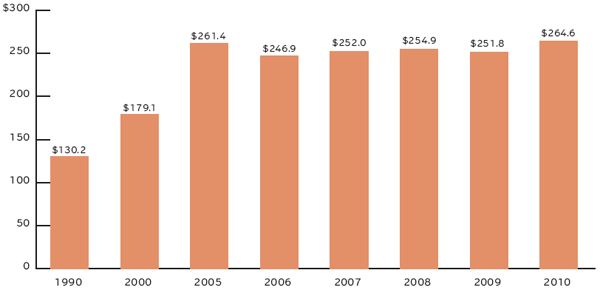
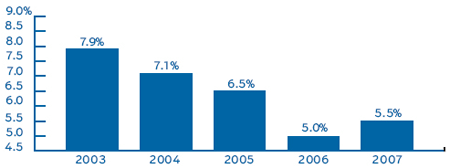
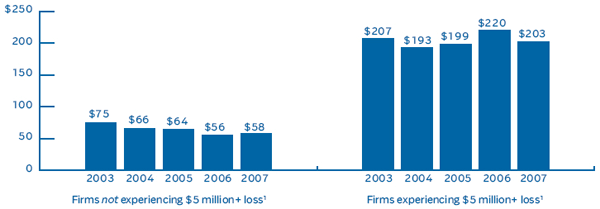
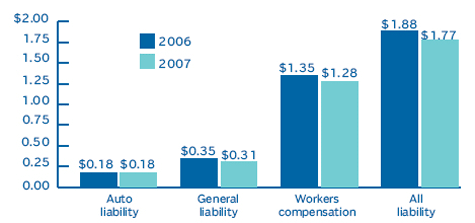
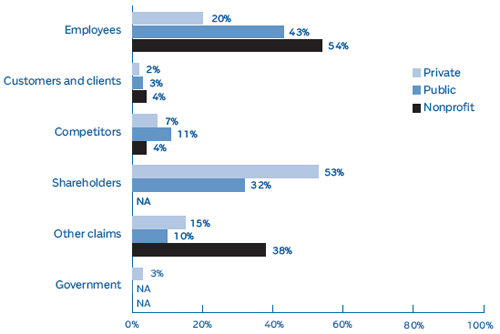
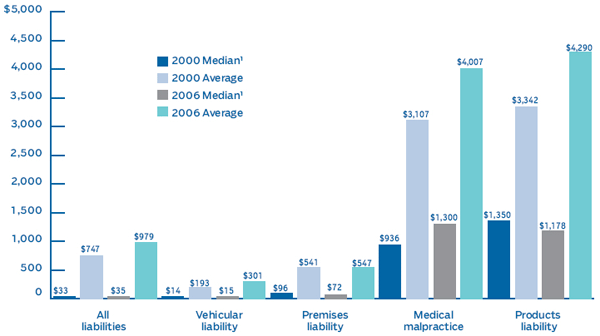
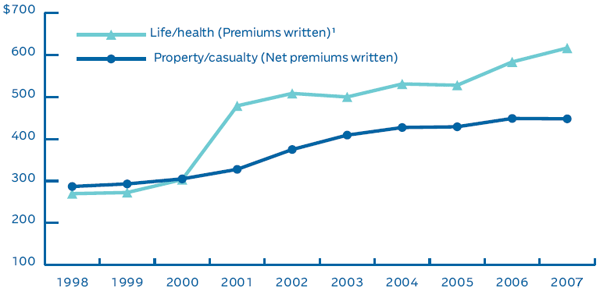

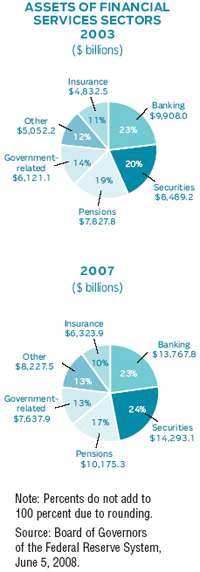
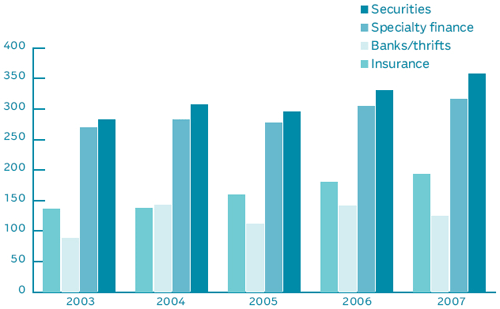
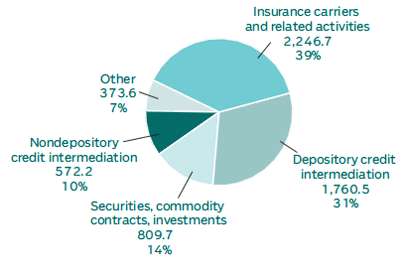
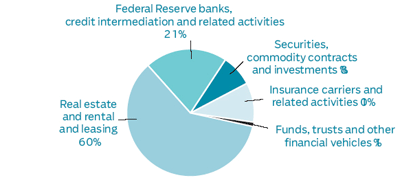
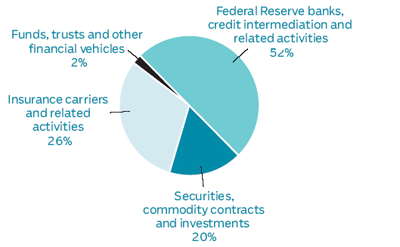
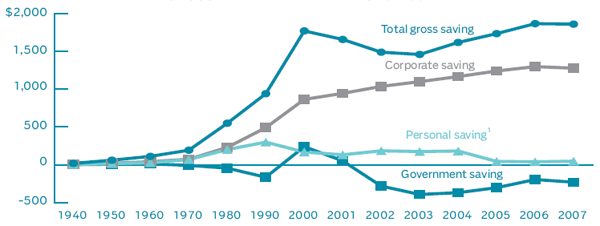
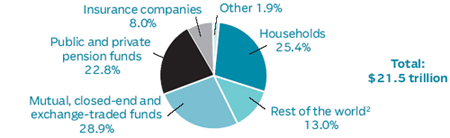
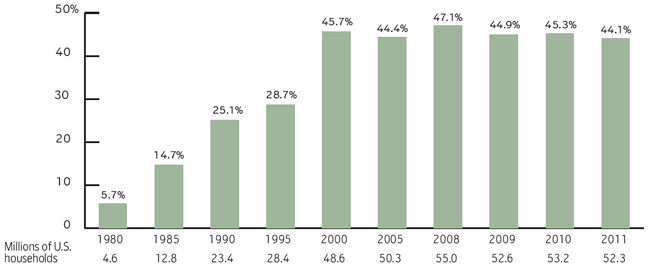
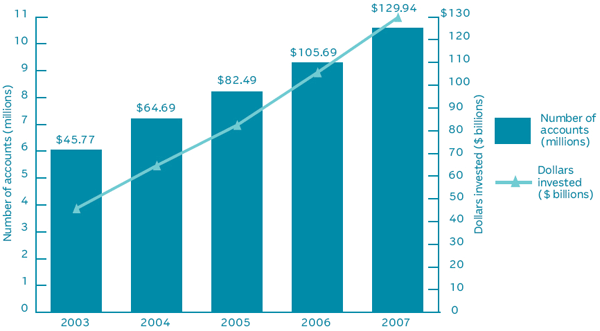
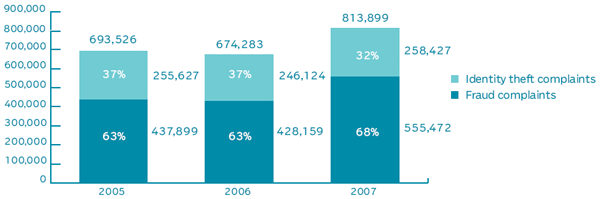
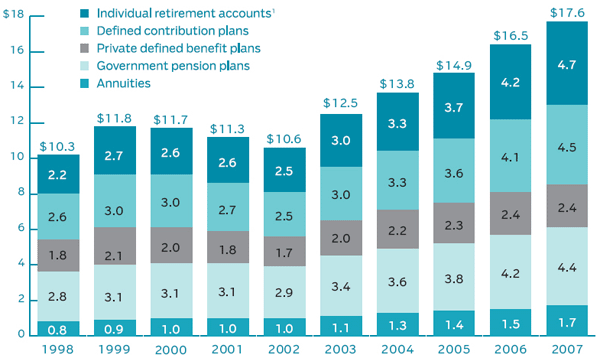
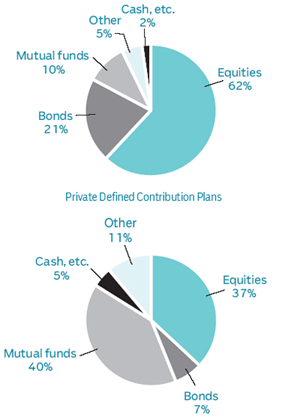
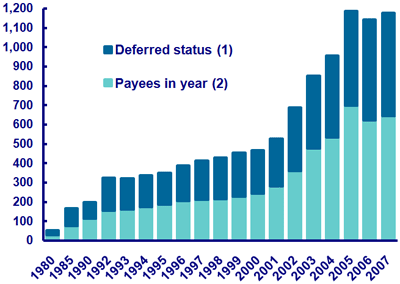
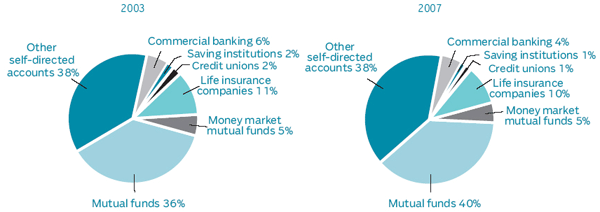
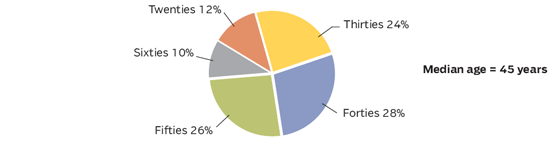
 Plans, 2020")

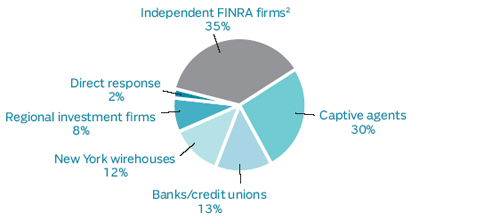
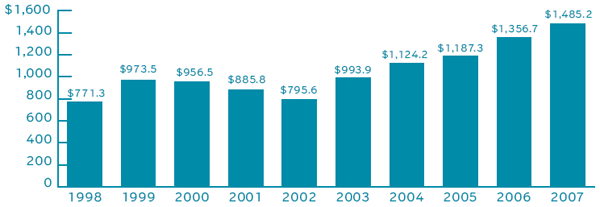
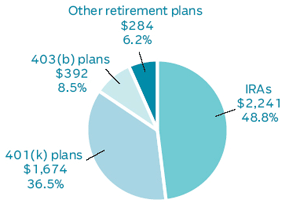
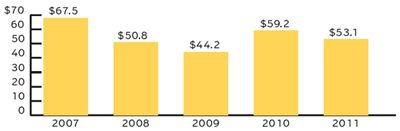
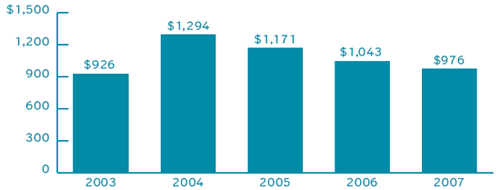
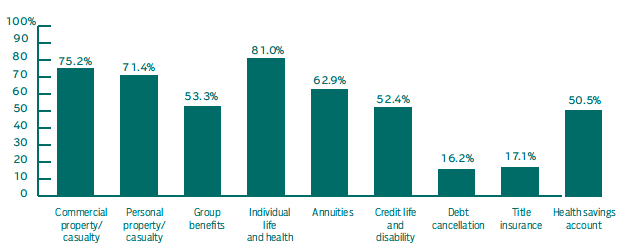
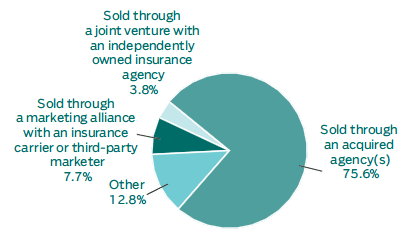
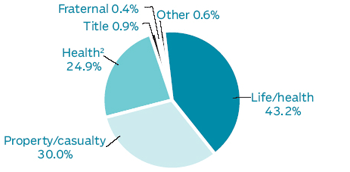
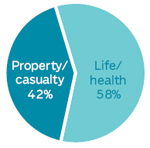
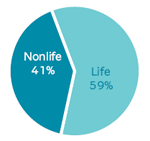
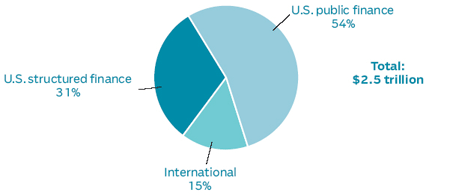
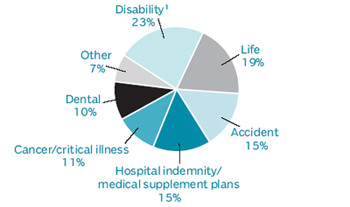
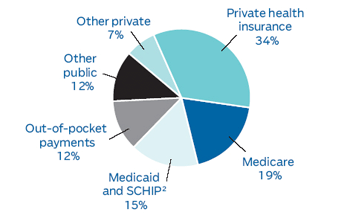
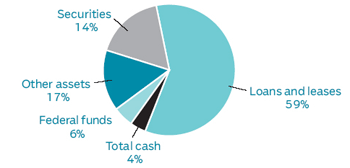
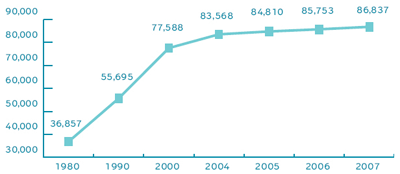
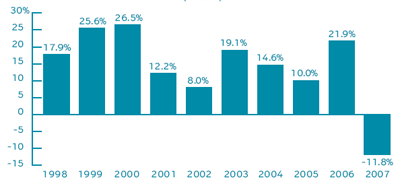
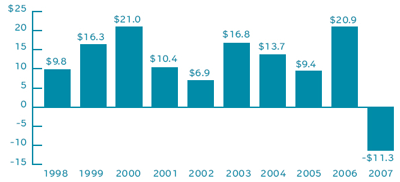
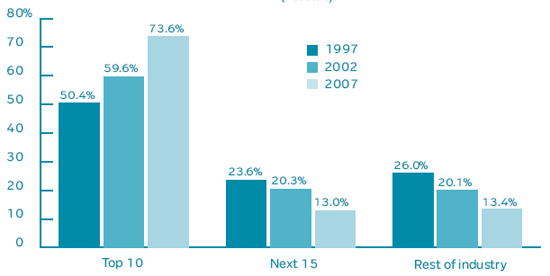
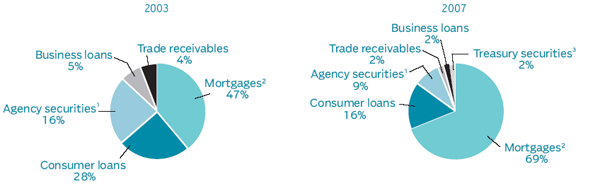
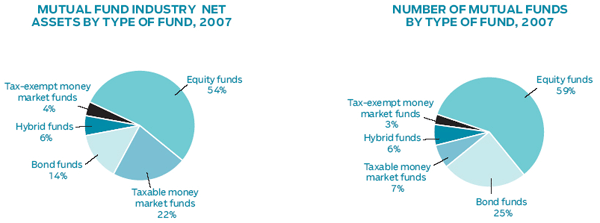
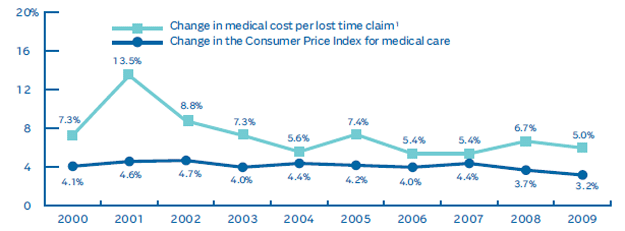
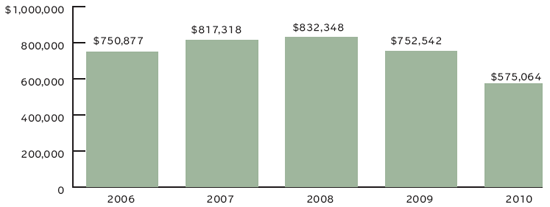
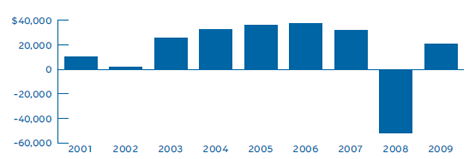
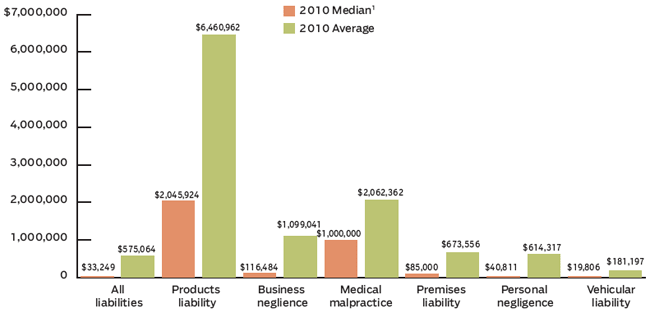
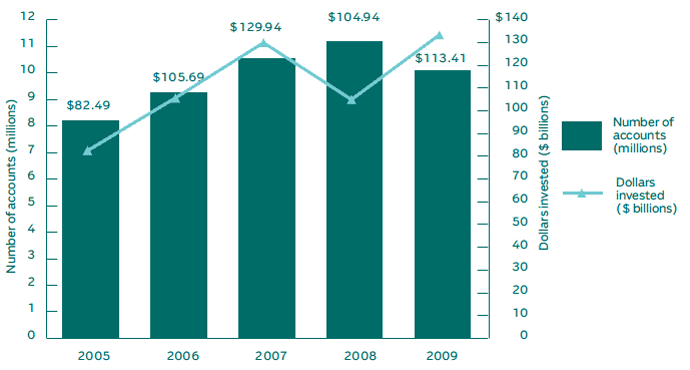
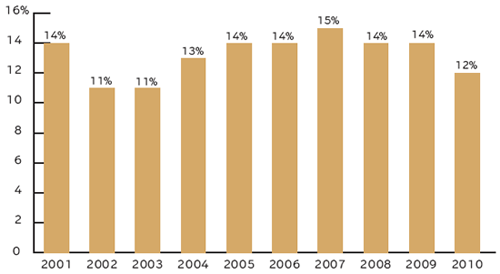
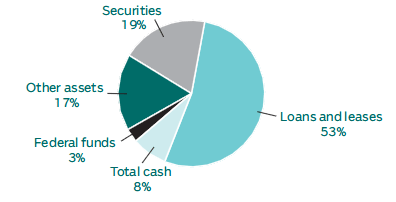
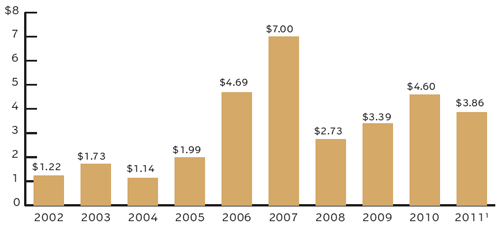
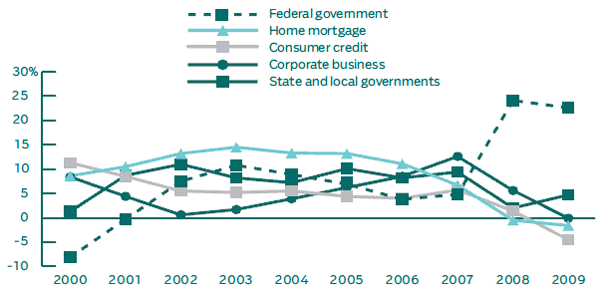
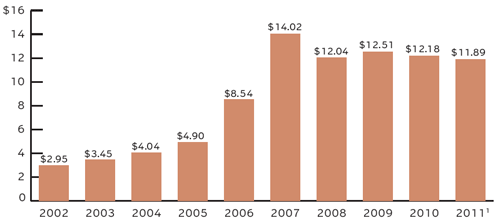
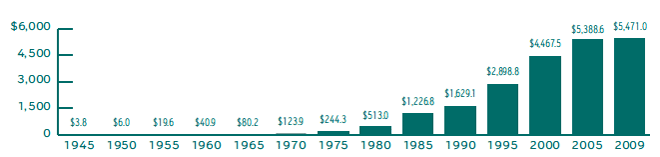
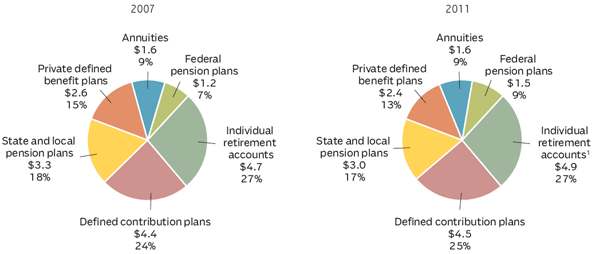
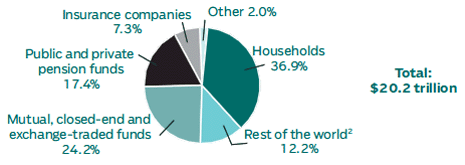
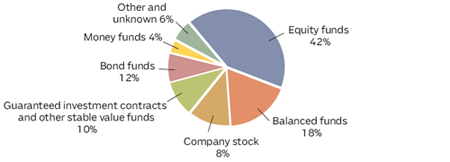
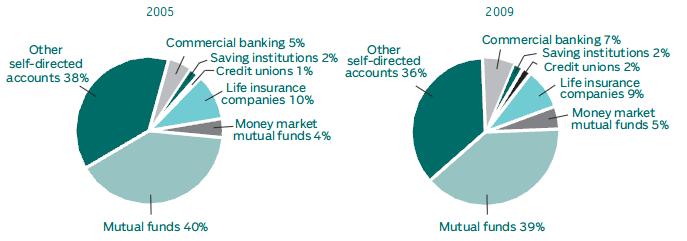
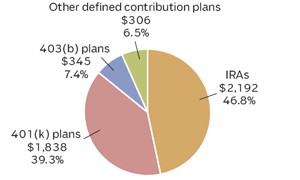
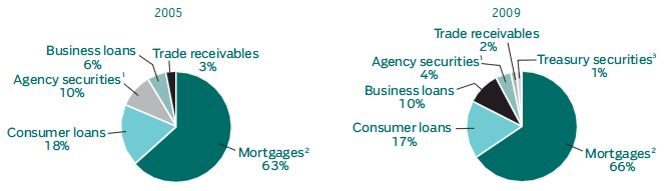
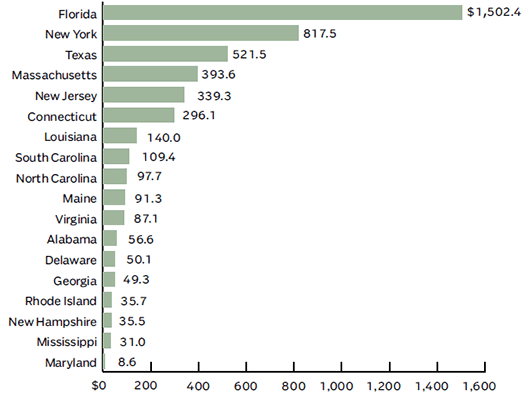
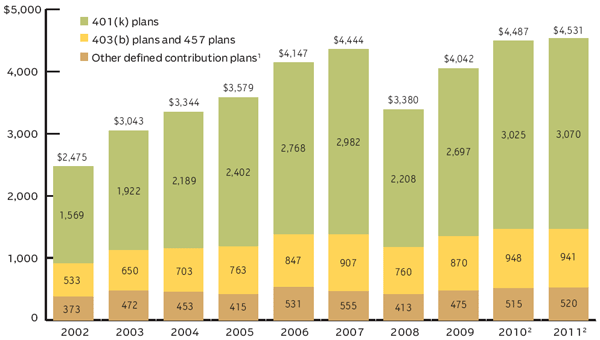
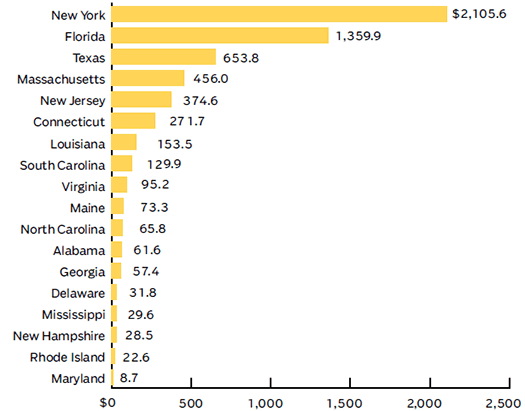
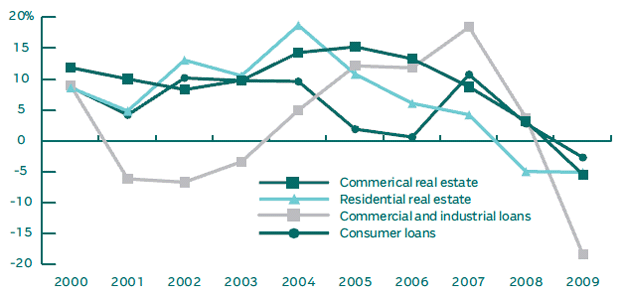
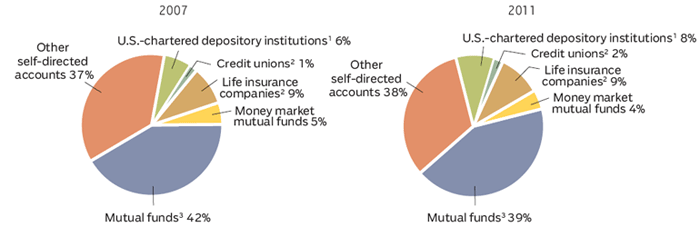
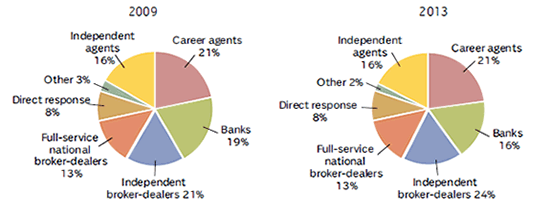
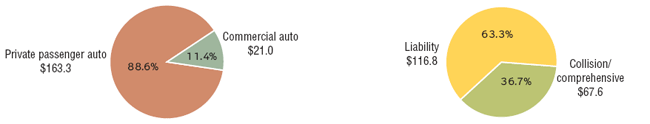
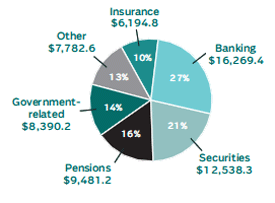
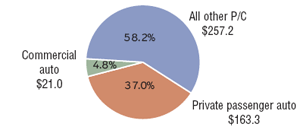
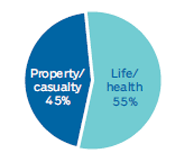
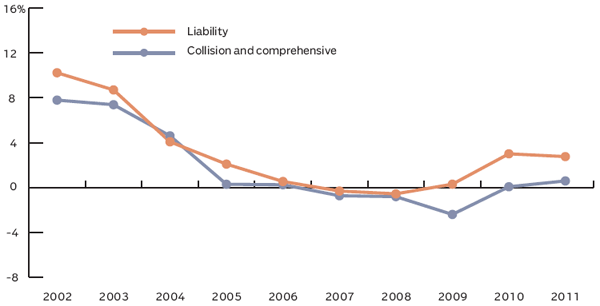
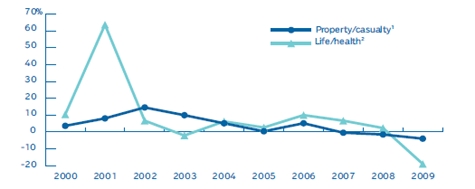
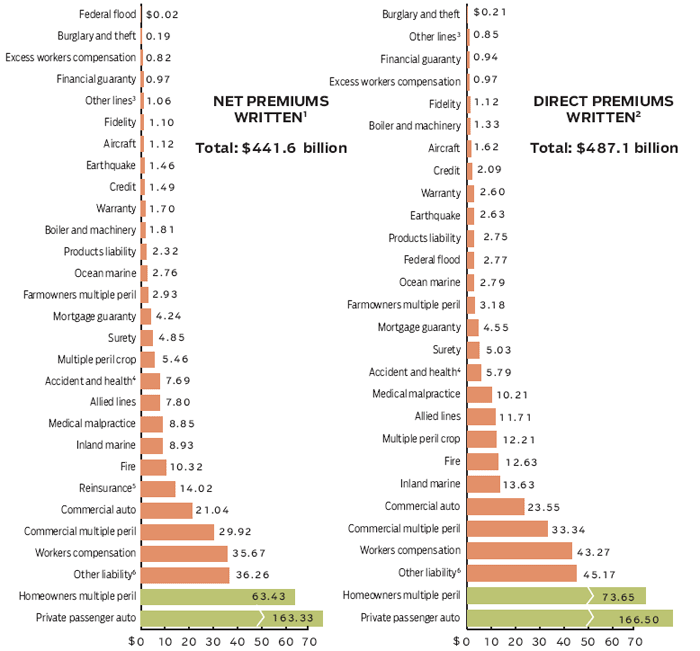
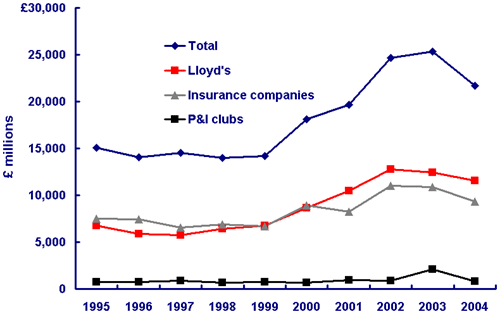
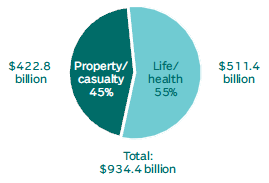
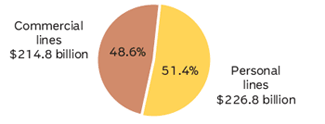
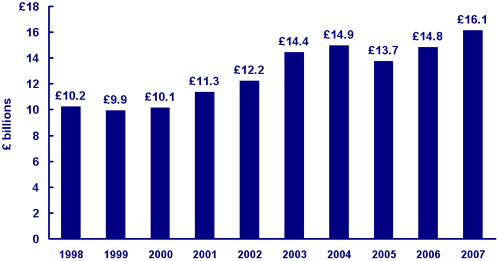
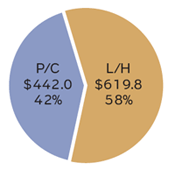
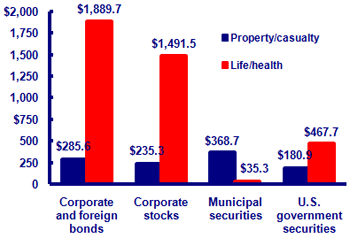
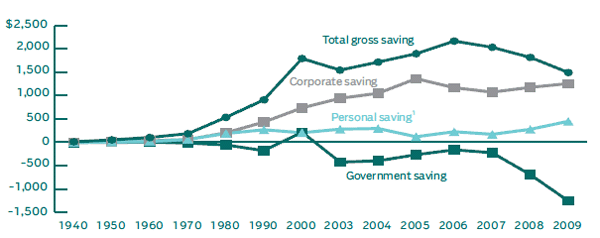
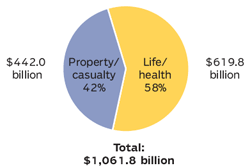
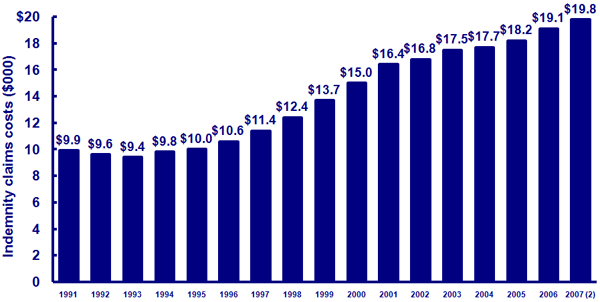
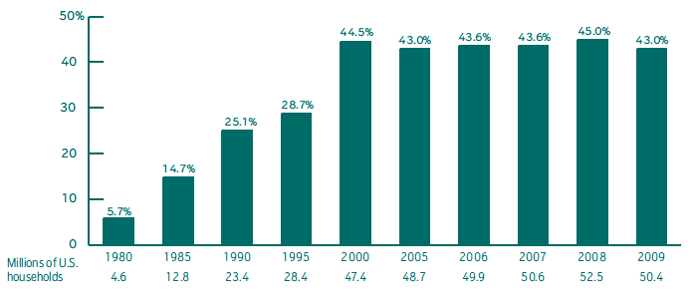
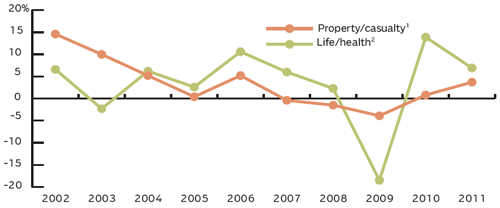
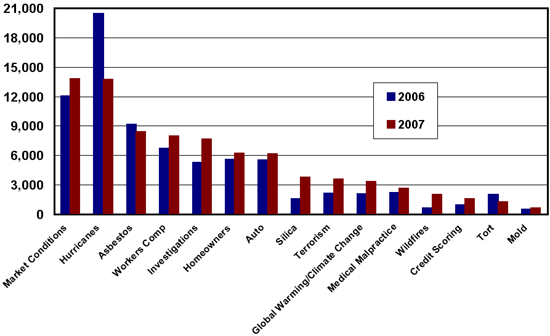
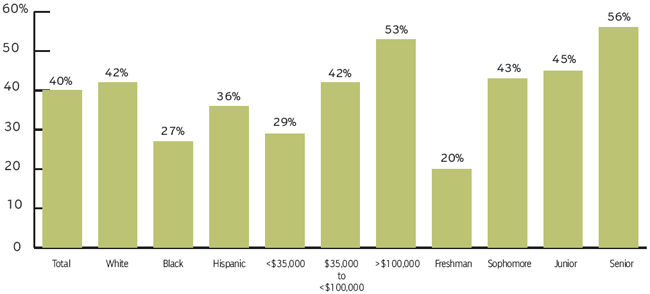
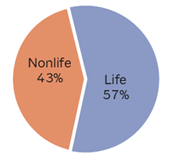
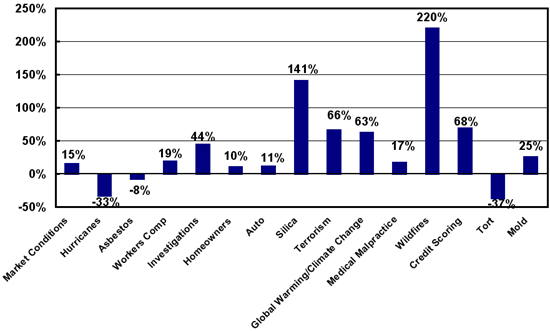
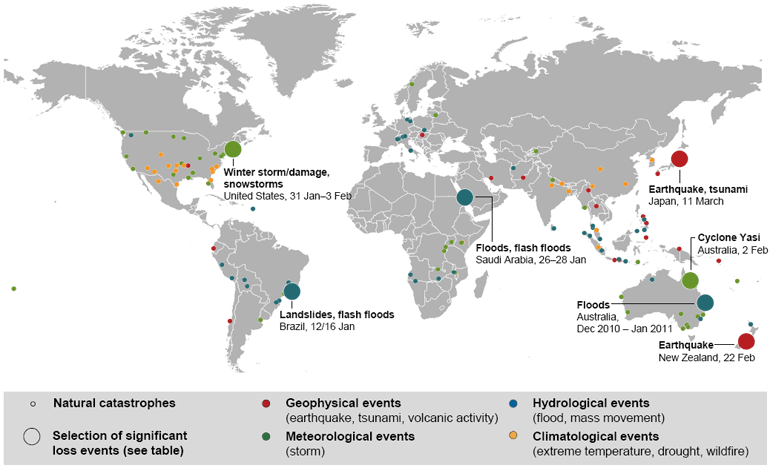

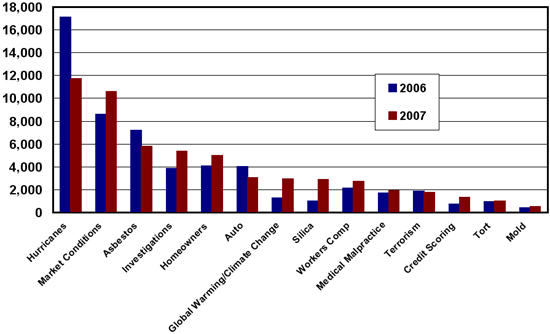

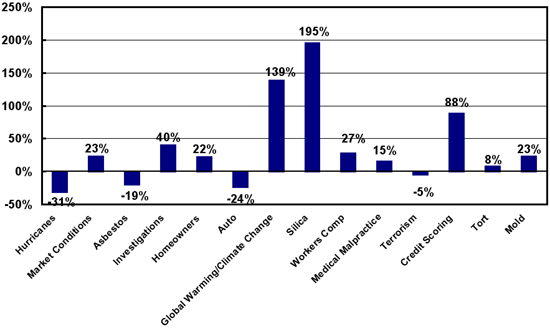
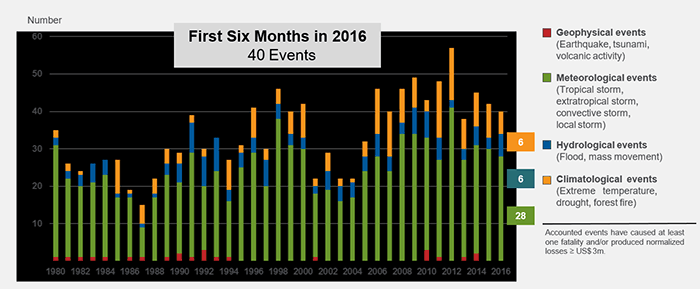
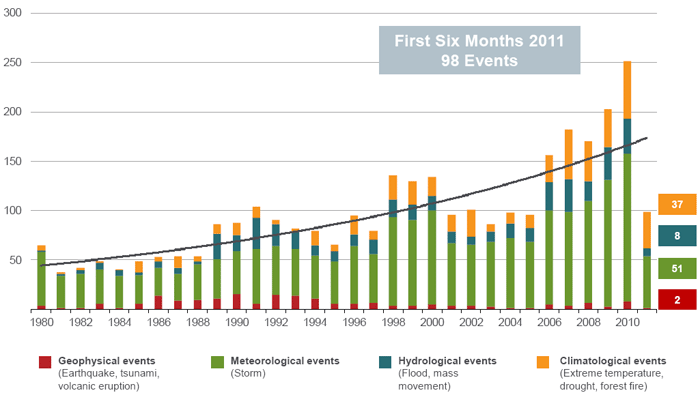
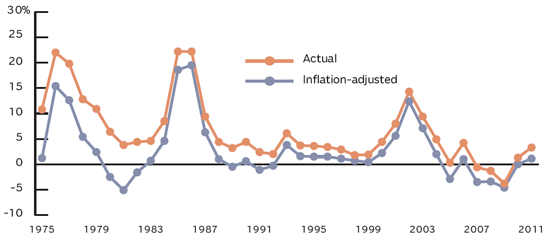
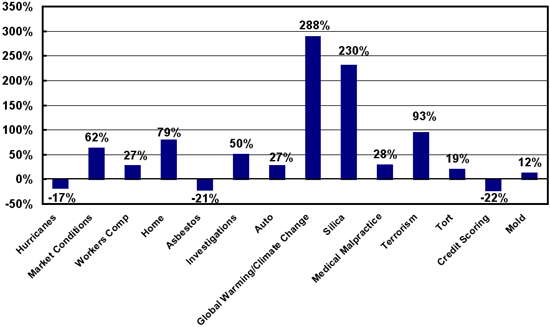
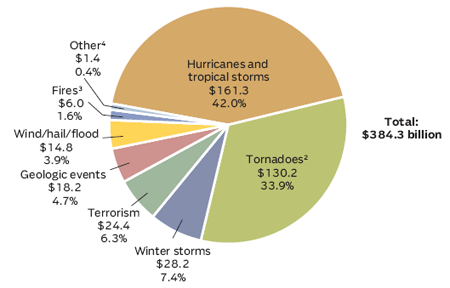
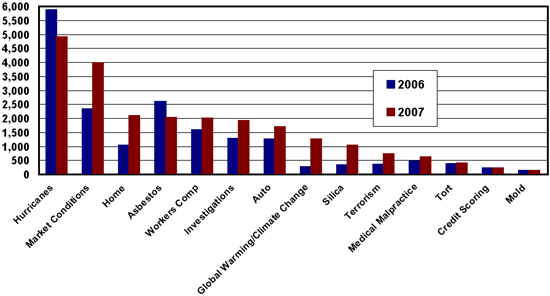
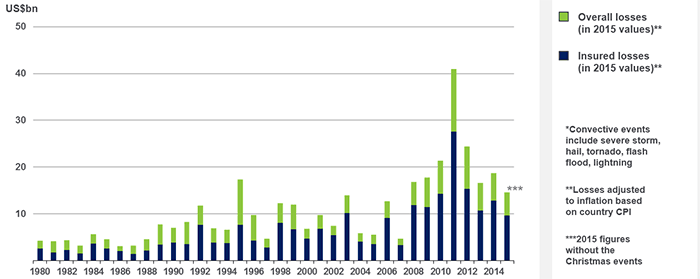

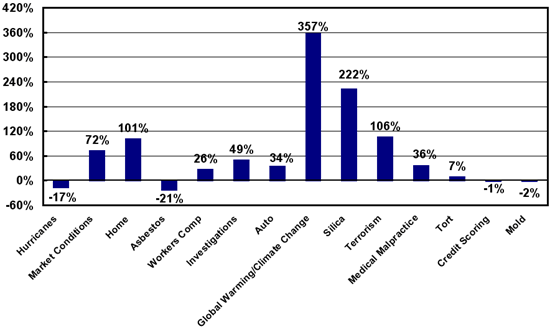

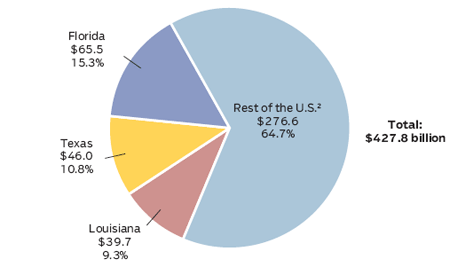


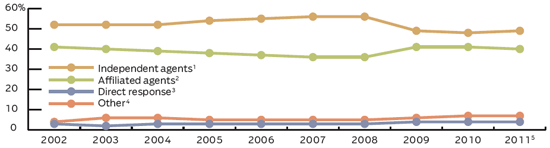

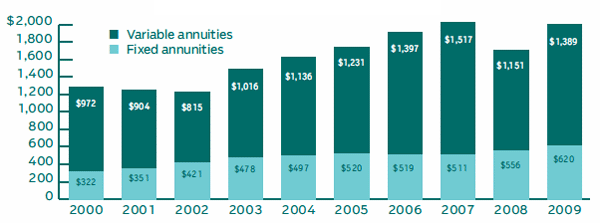

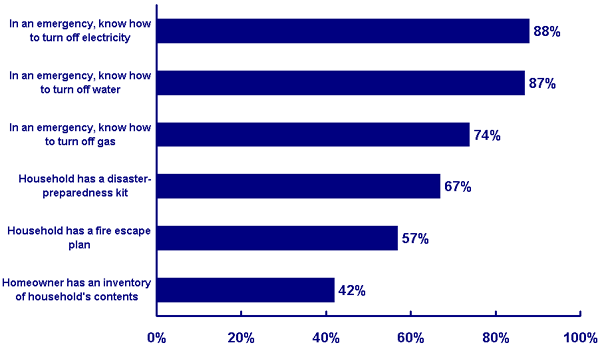
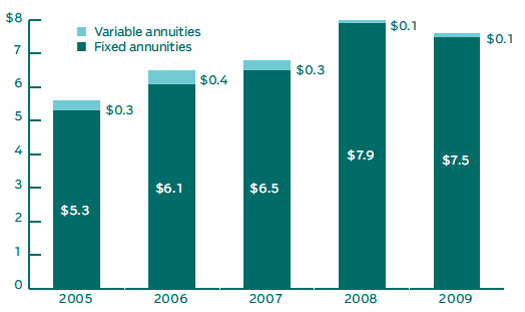

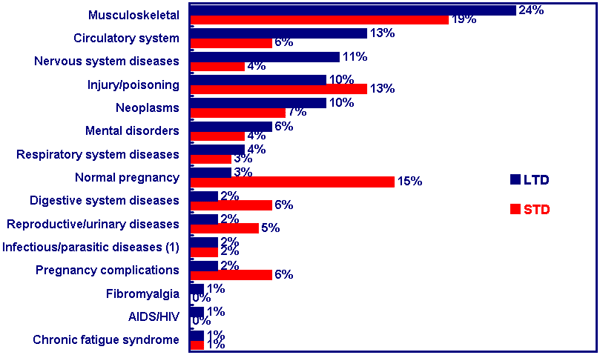
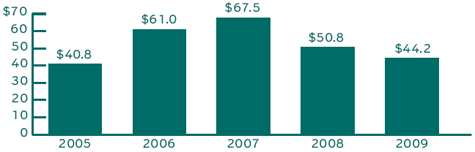

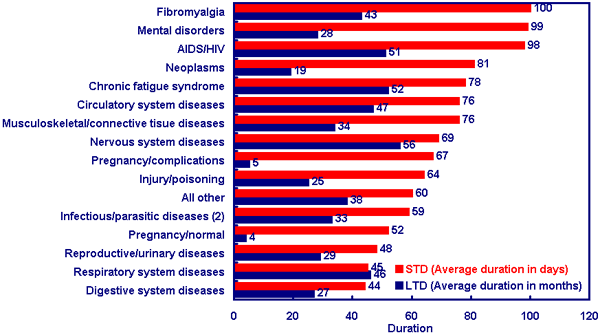
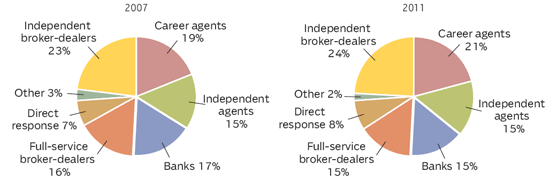

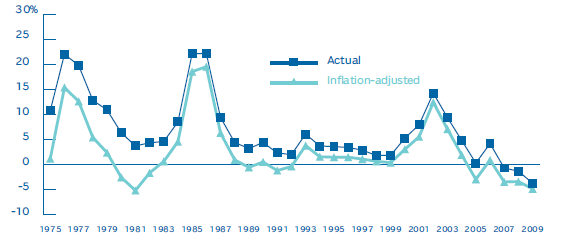
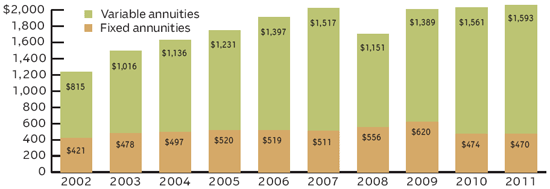

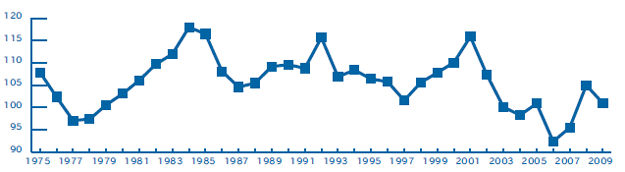
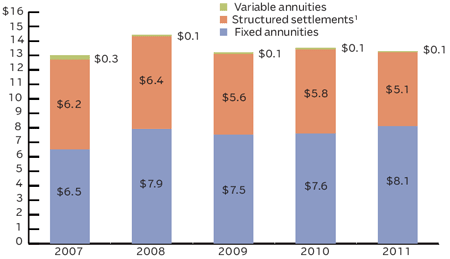

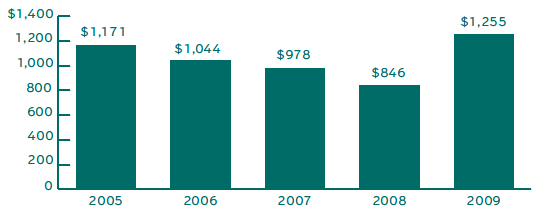
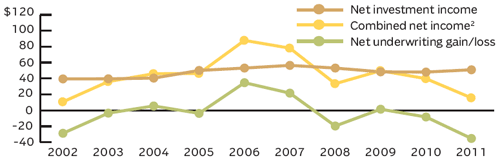

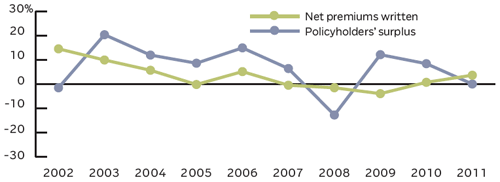
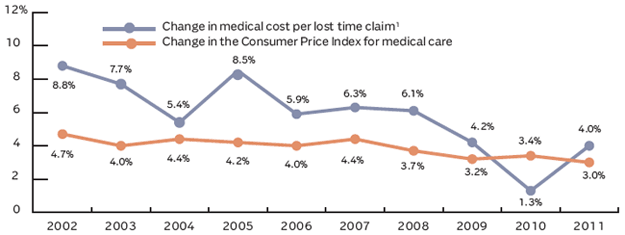
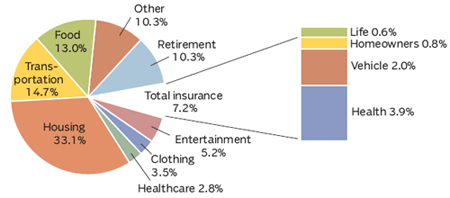

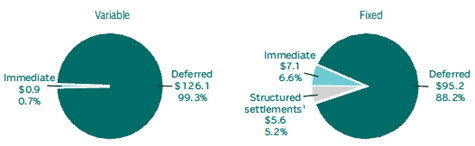
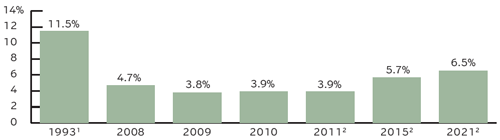
")
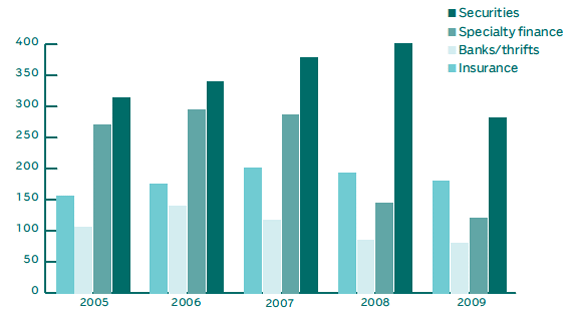
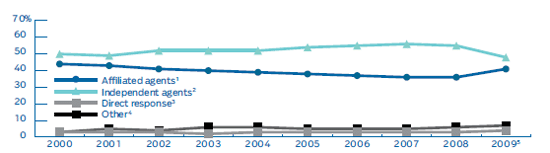
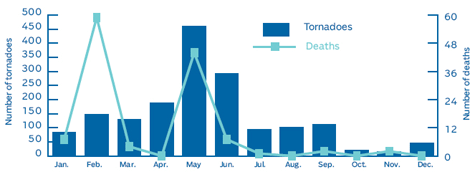
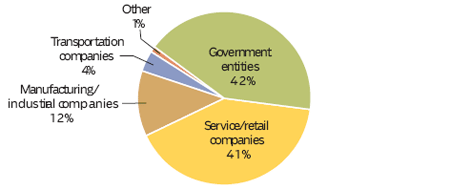

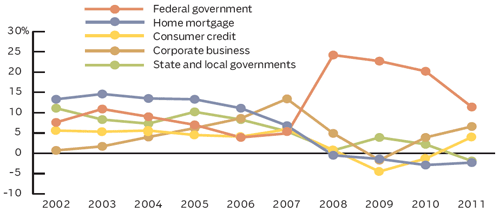
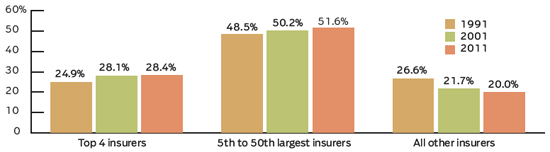
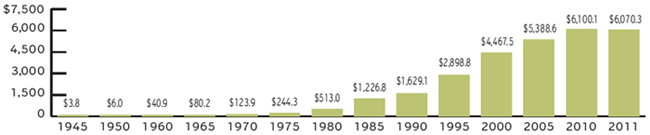
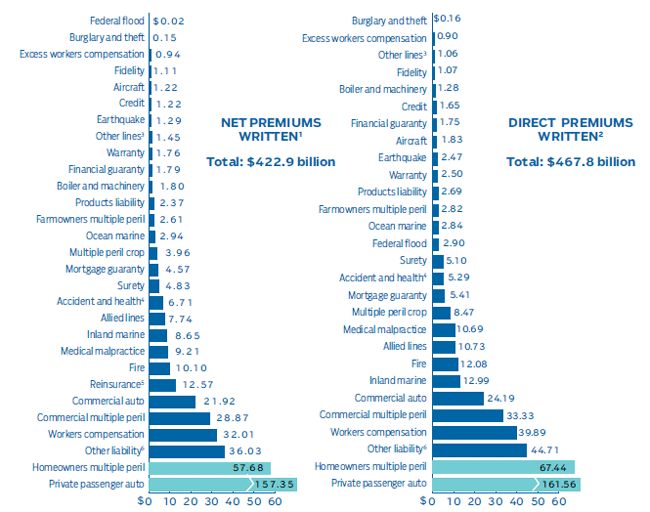
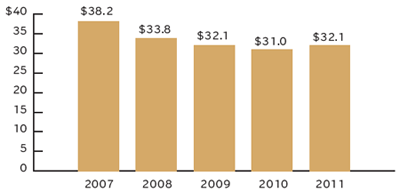
")
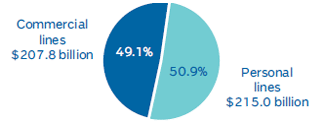
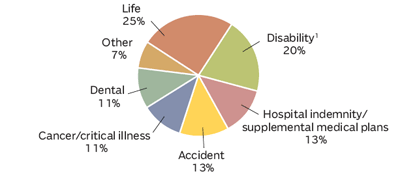
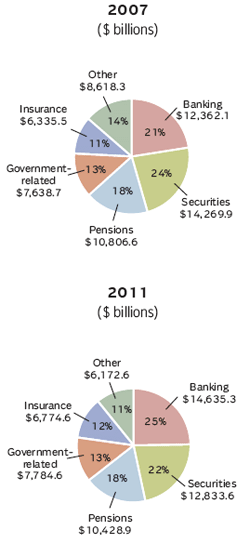
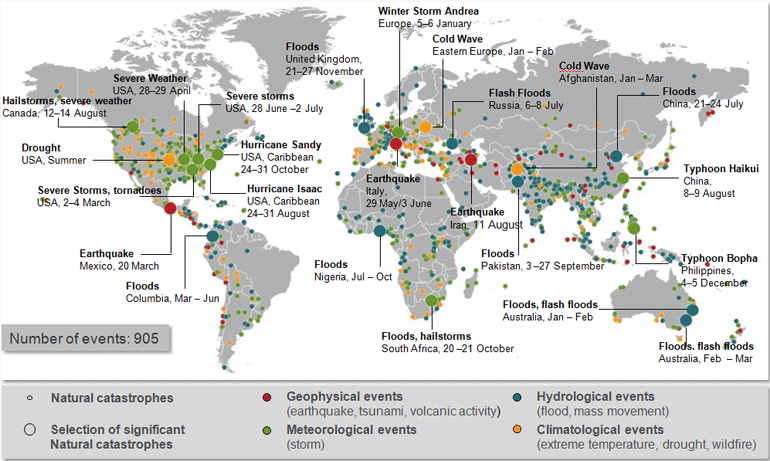
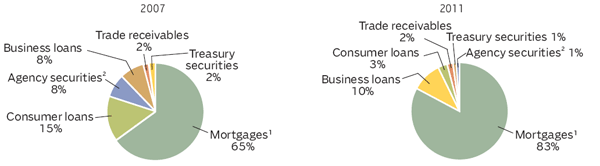
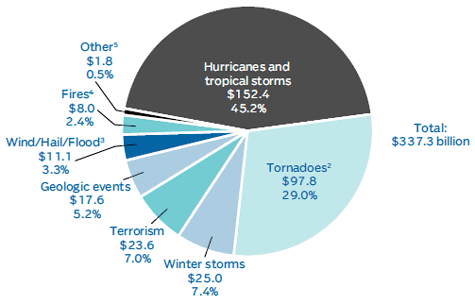
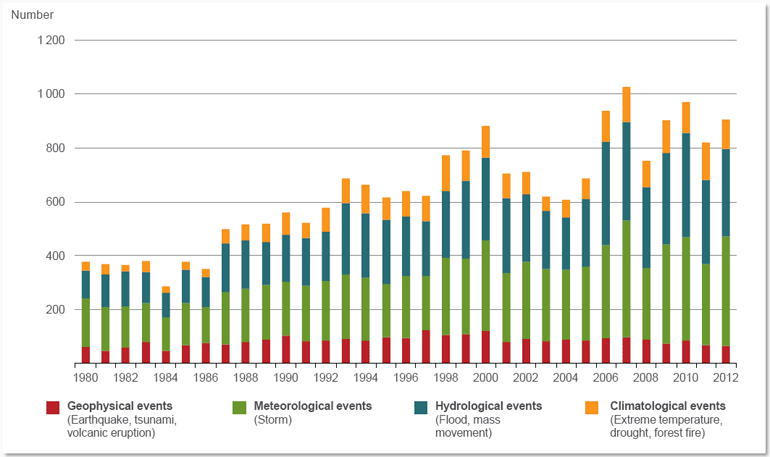
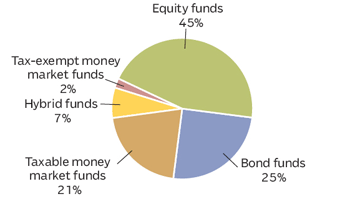
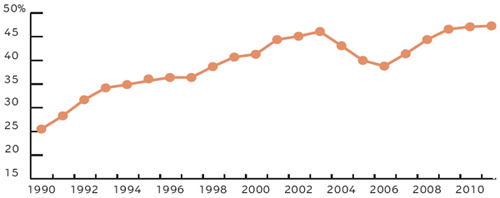
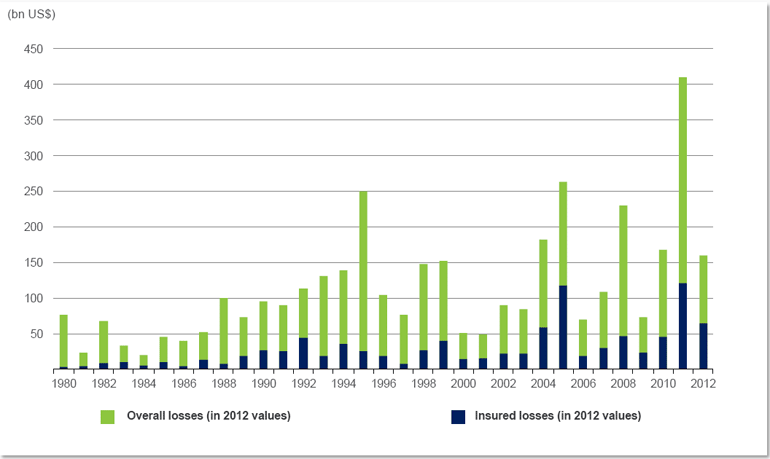
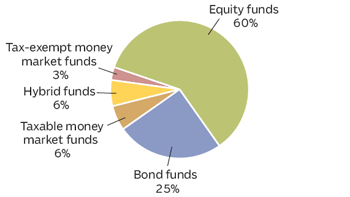
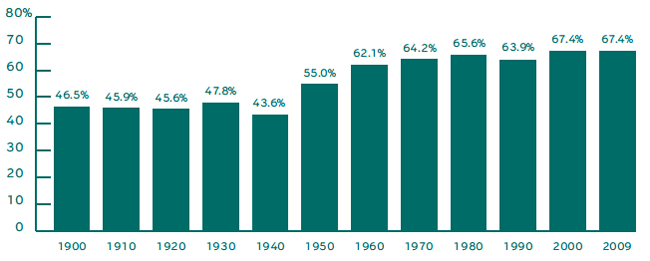
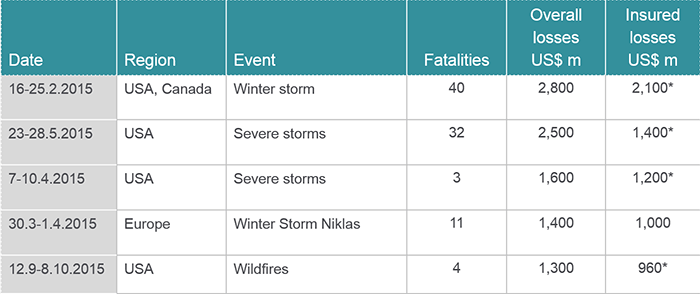

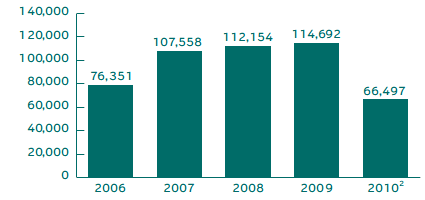
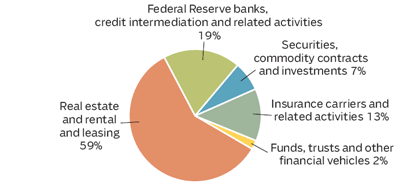
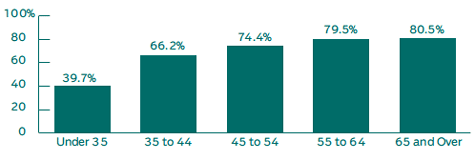
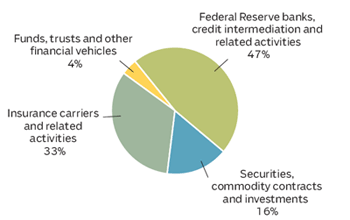
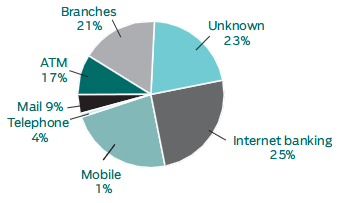
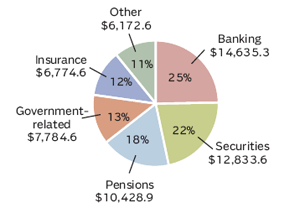

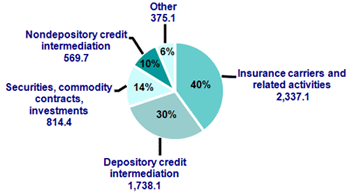
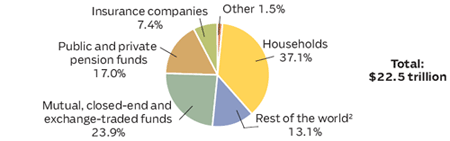
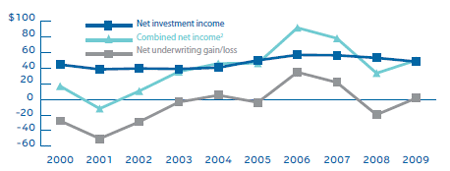
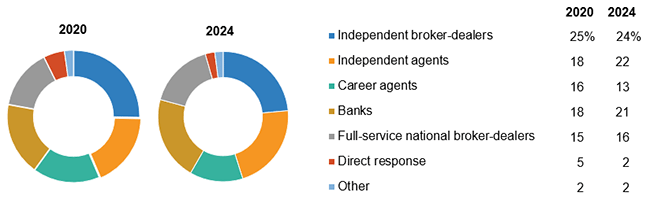
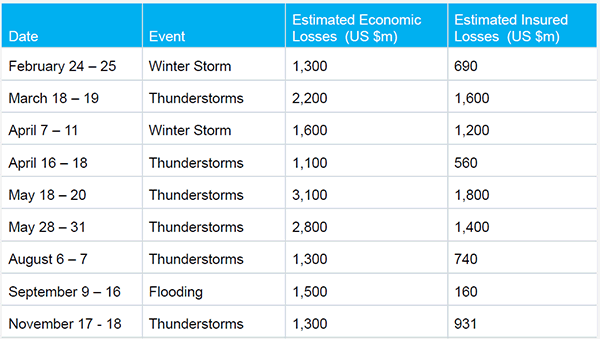
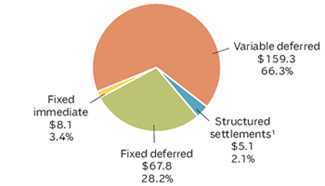
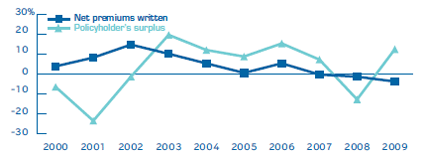
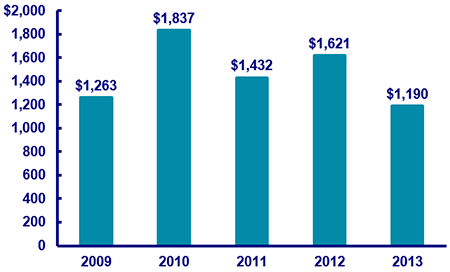
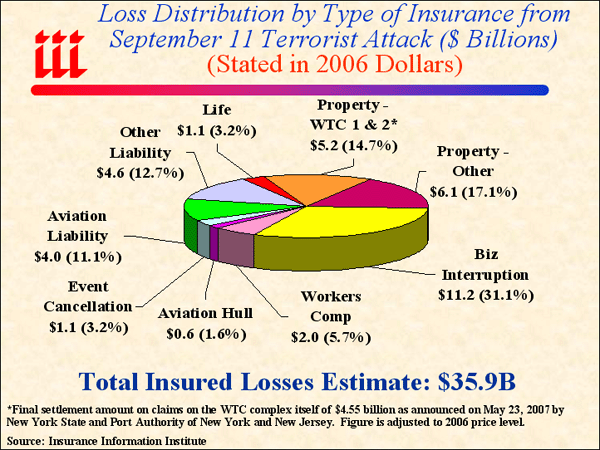
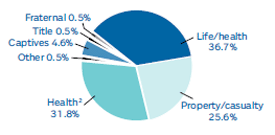
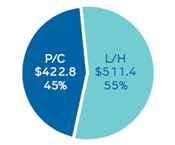
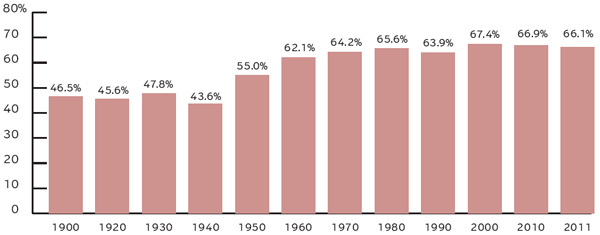
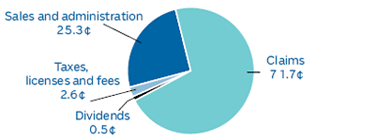
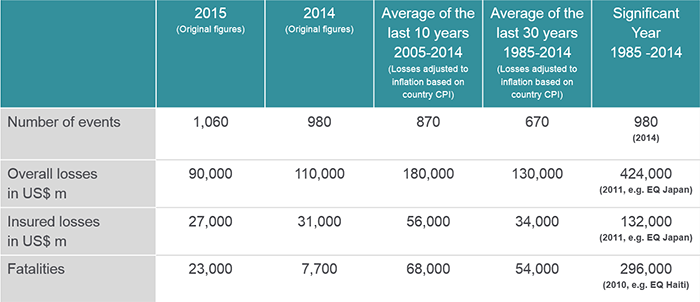
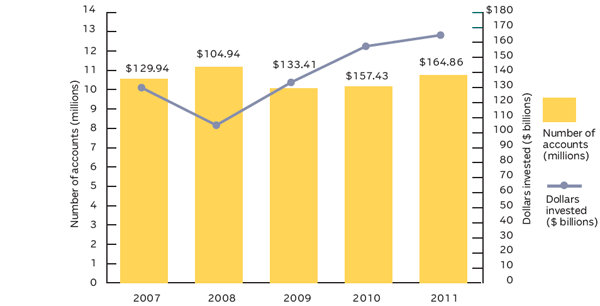
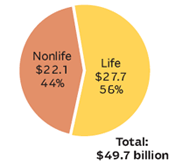
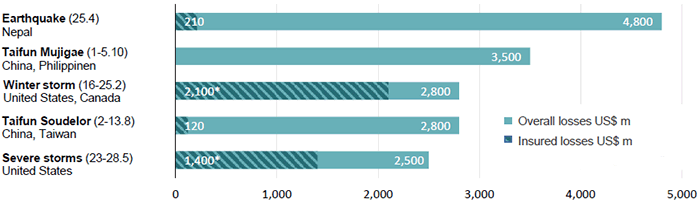
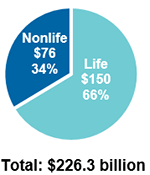

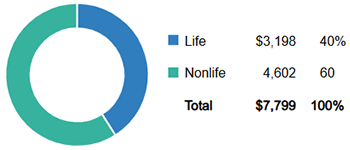
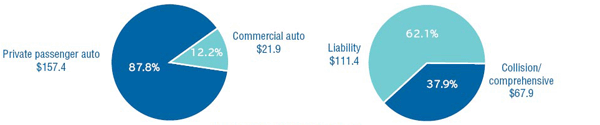
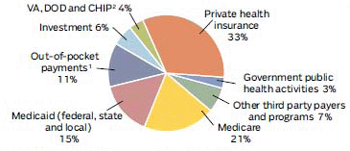
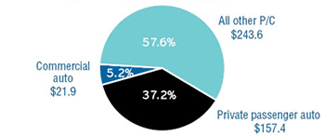

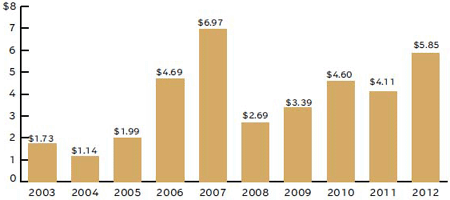
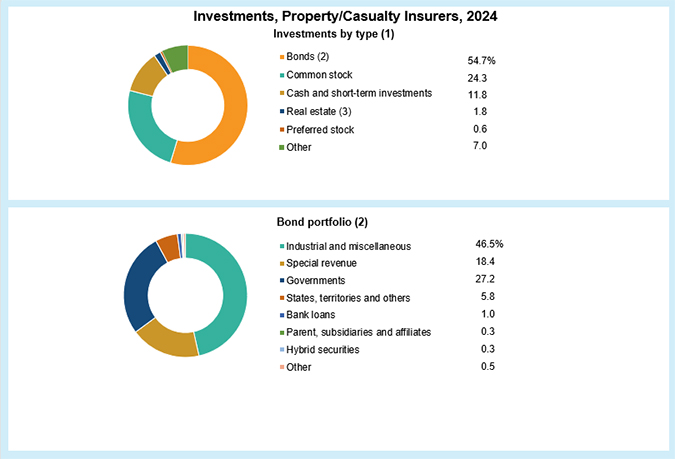
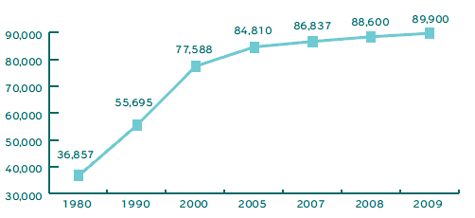
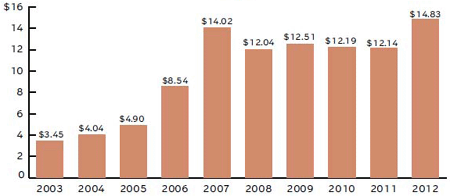
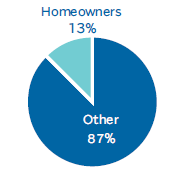
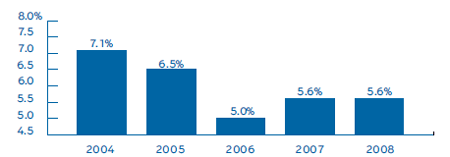
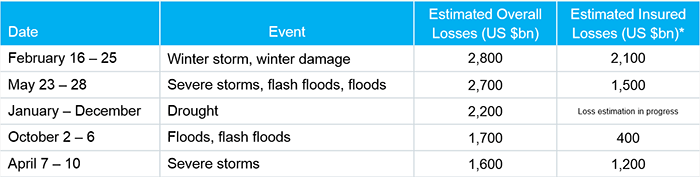
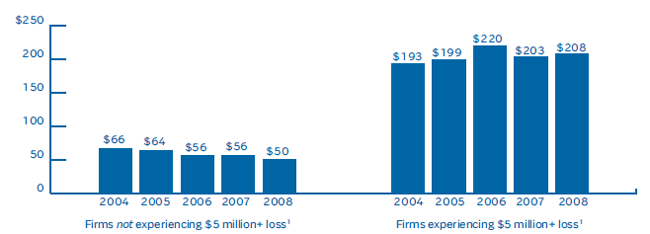
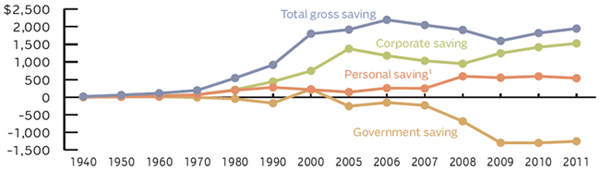
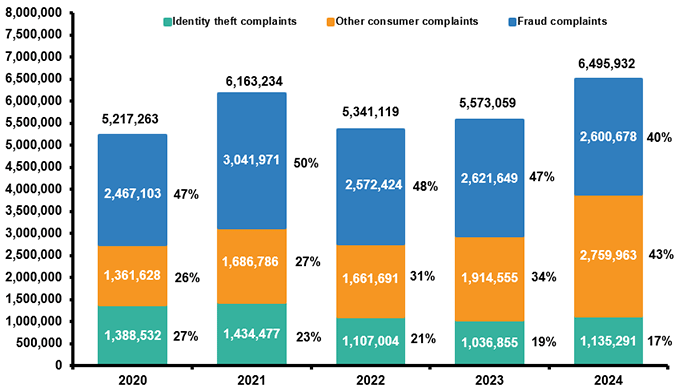
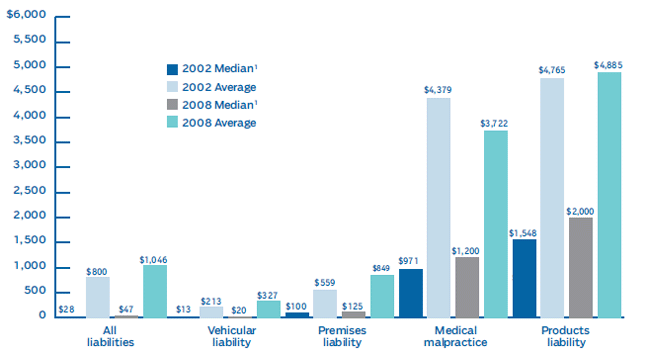
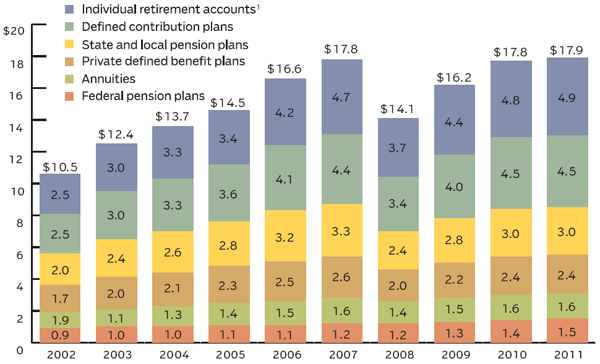
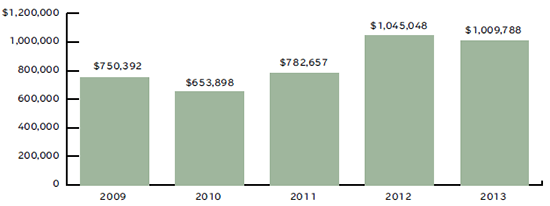
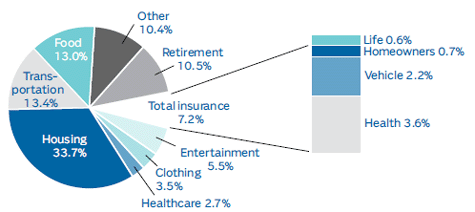
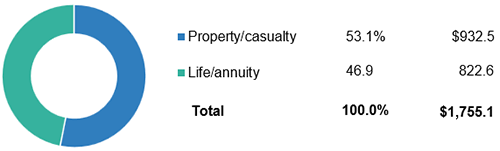
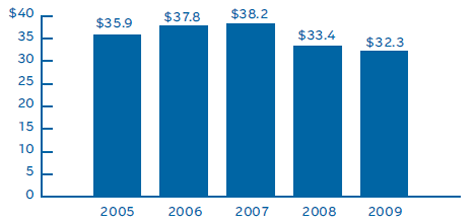
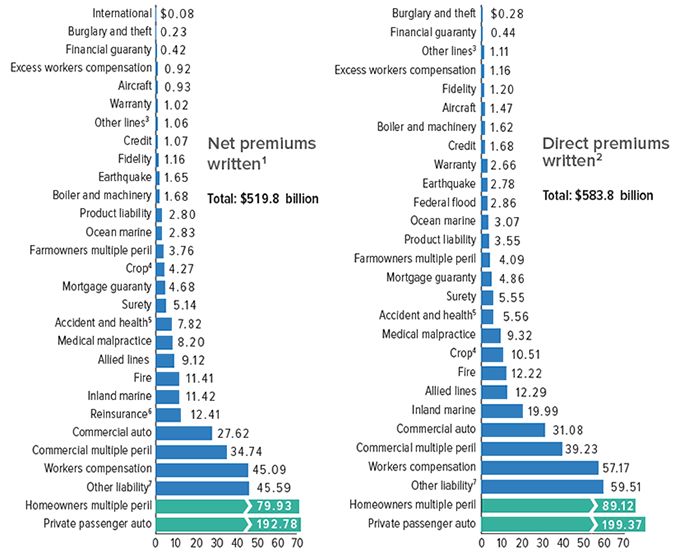
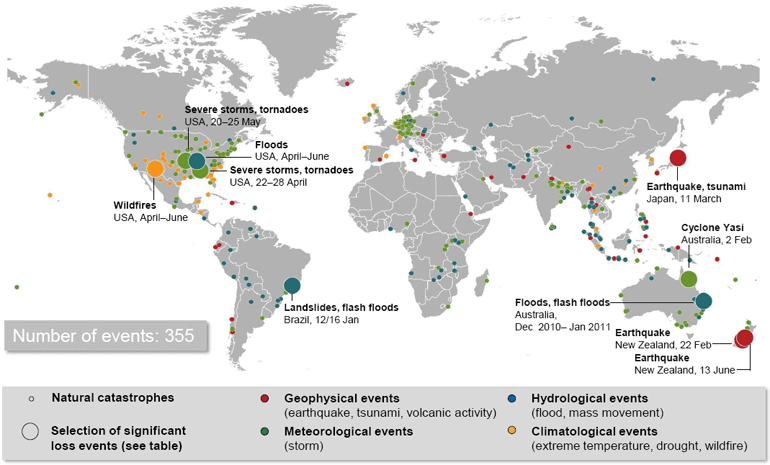
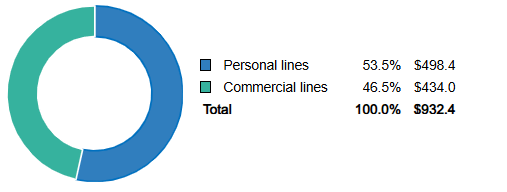
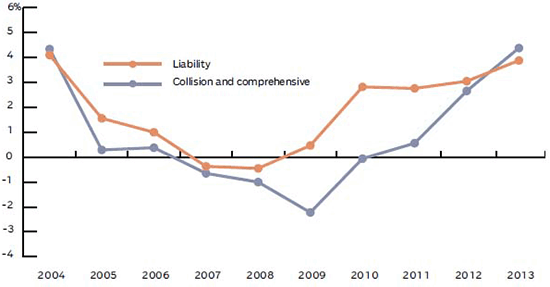
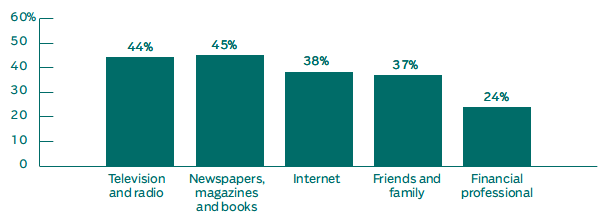
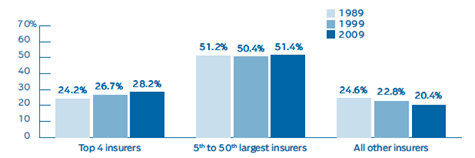
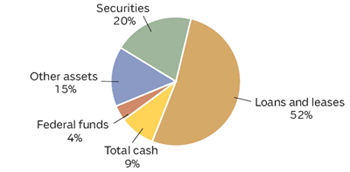
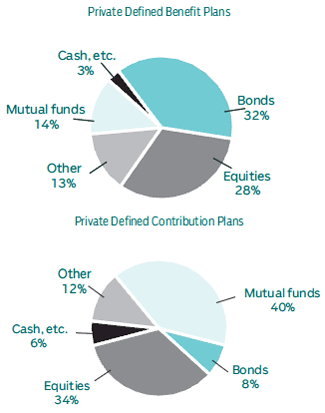
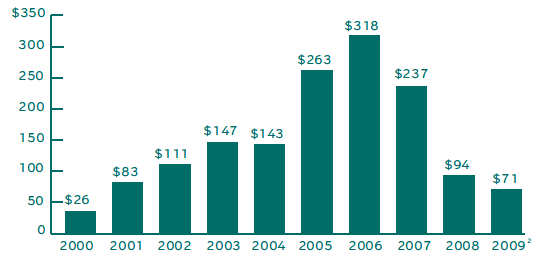
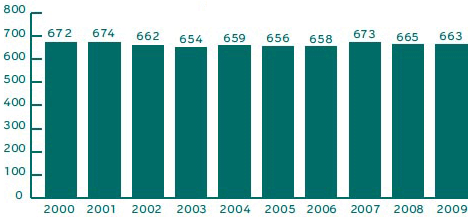
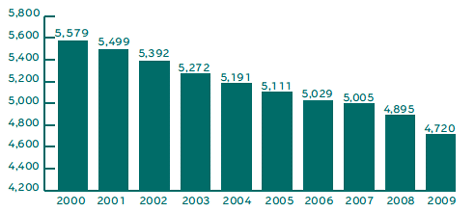
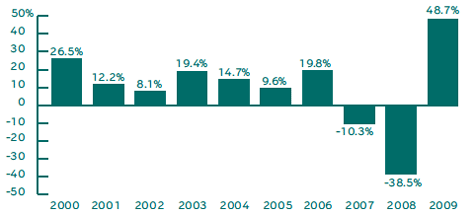
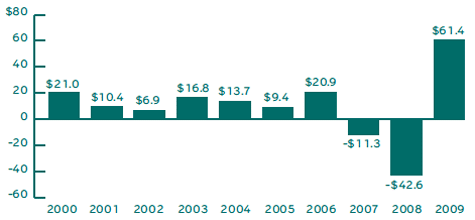
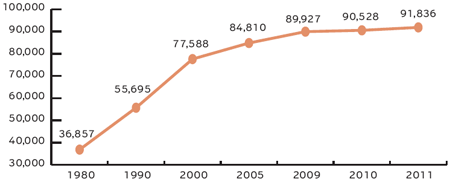
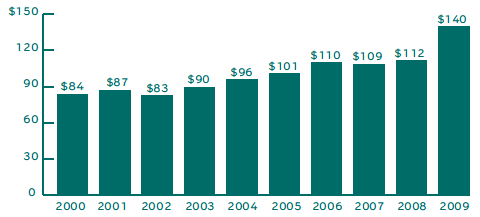

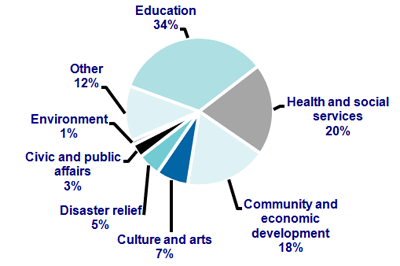
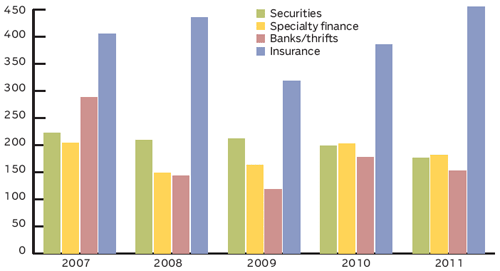
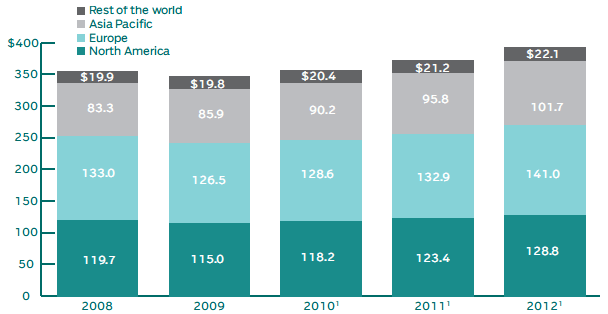
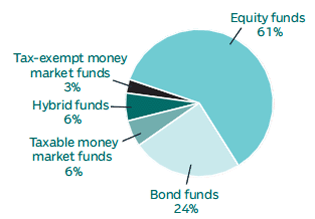
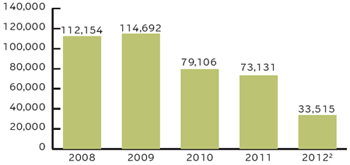
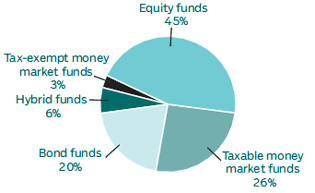
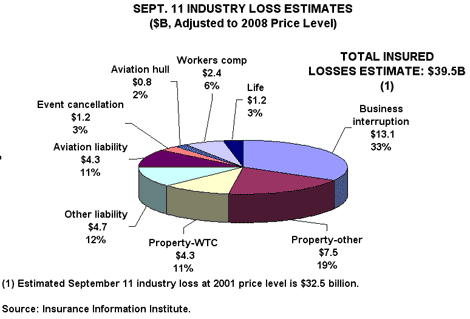
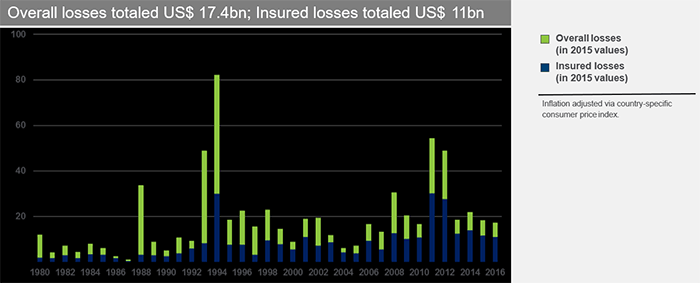
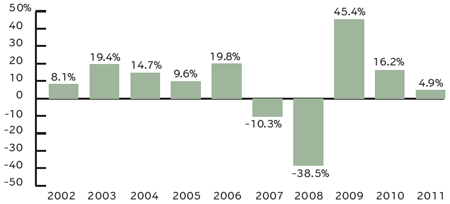
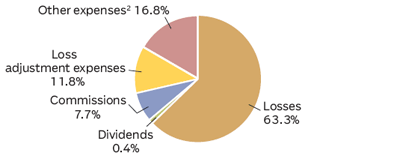
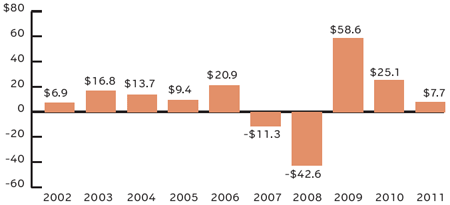
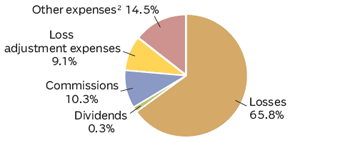
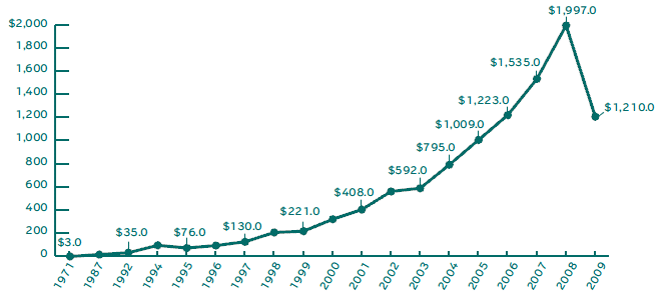
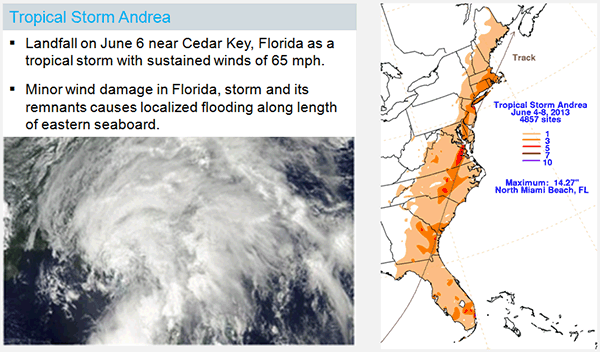
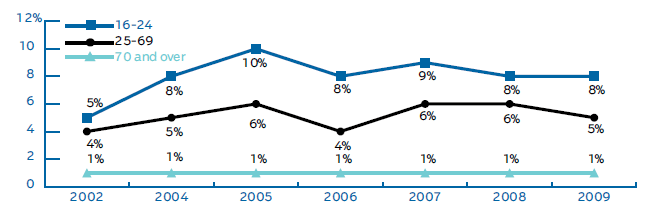
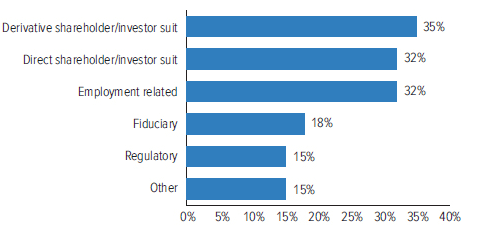
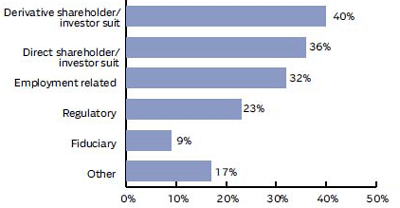
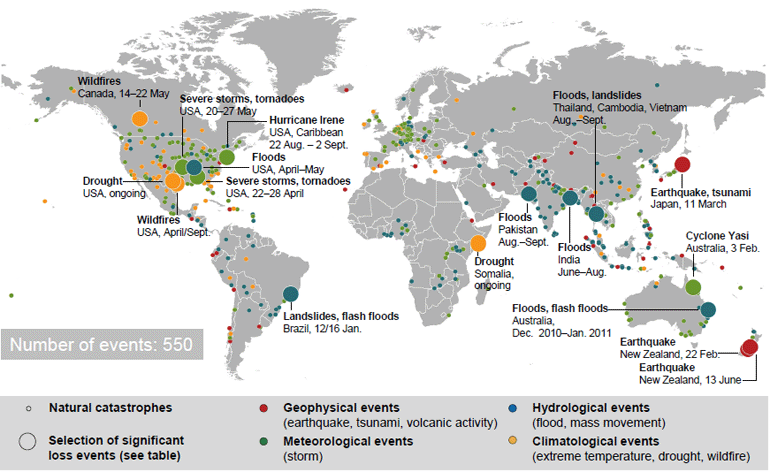
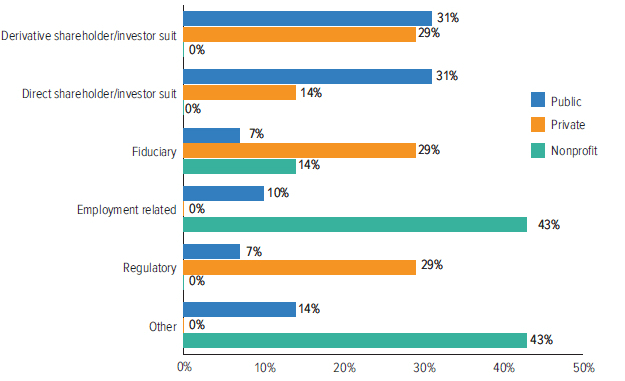
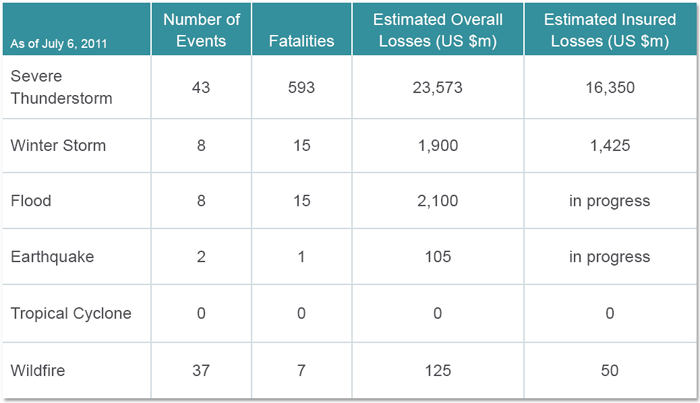
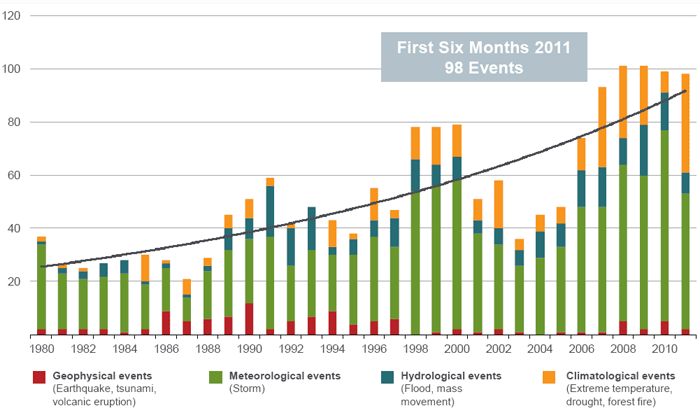
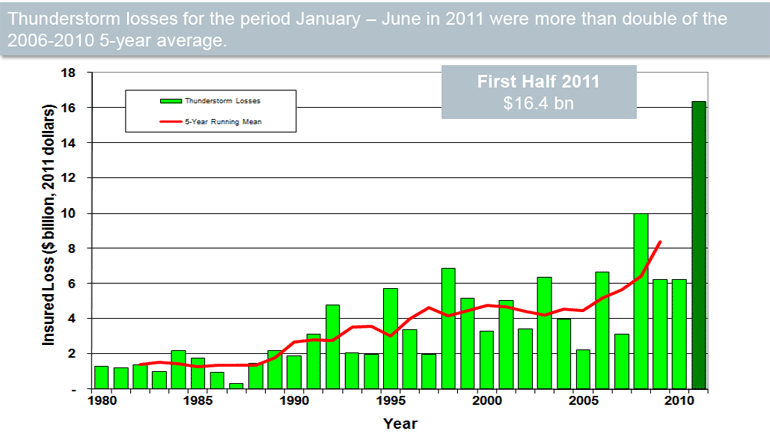
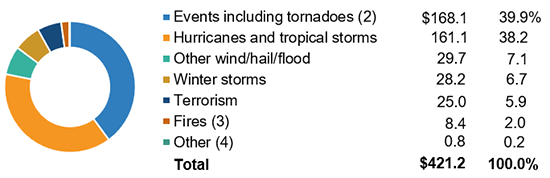
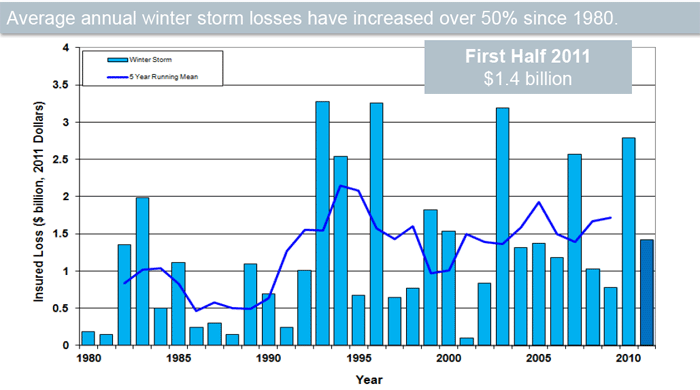

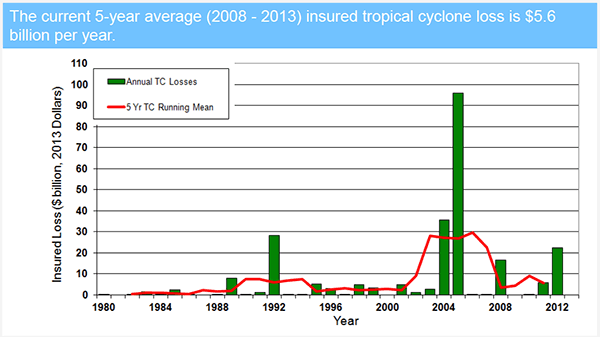
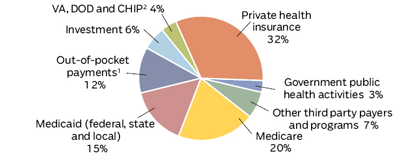
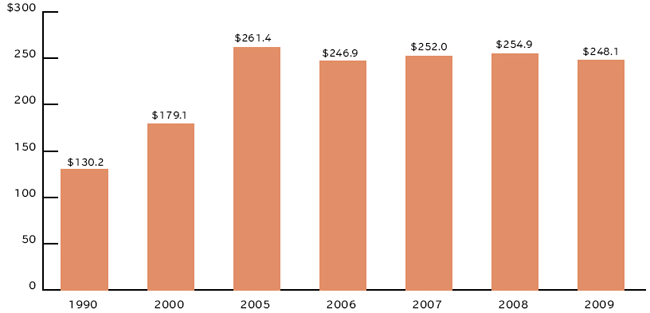
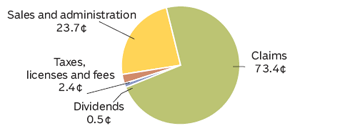
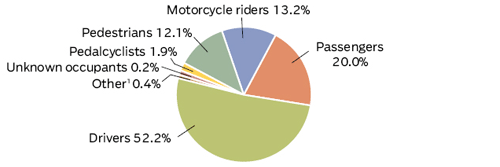
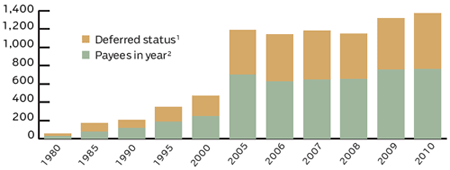
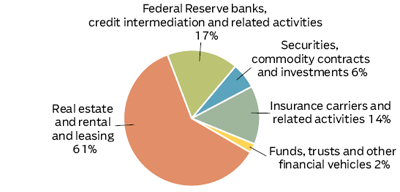
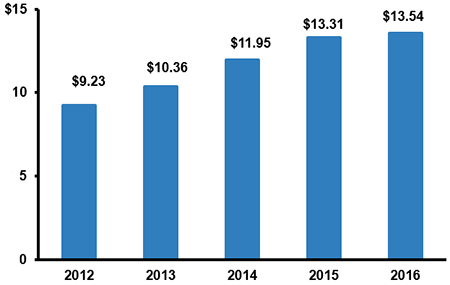
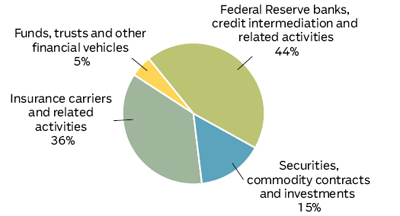
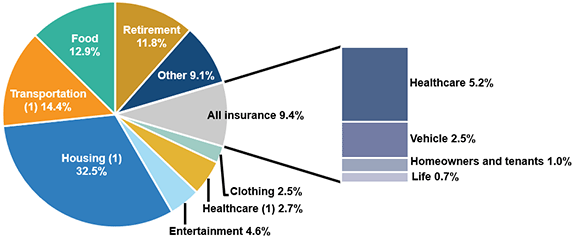
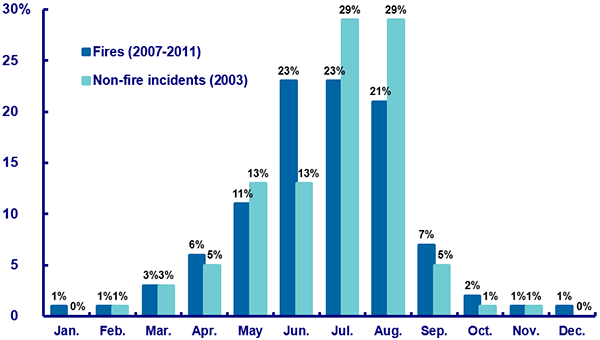
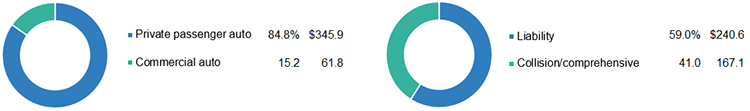
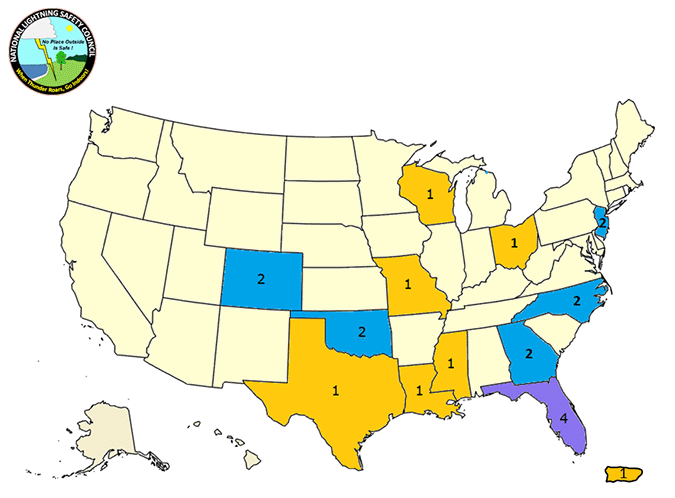
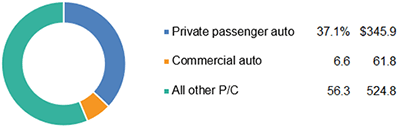
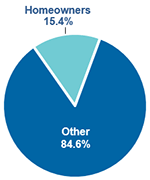

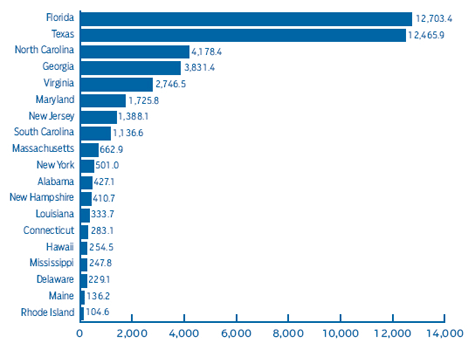
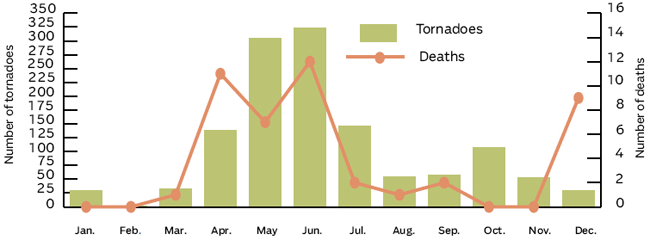
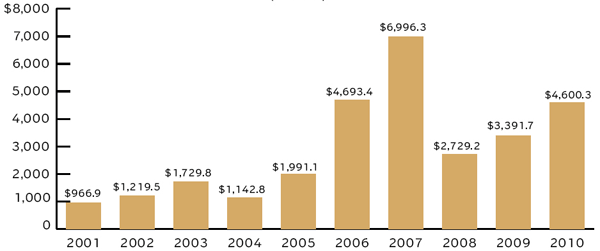
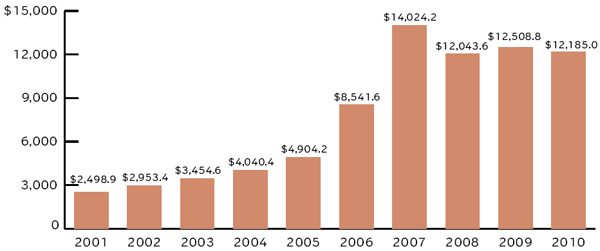
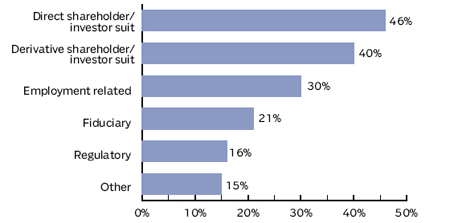
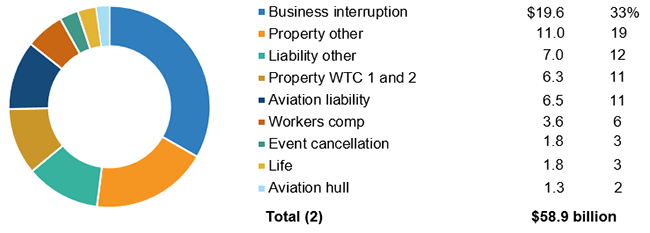
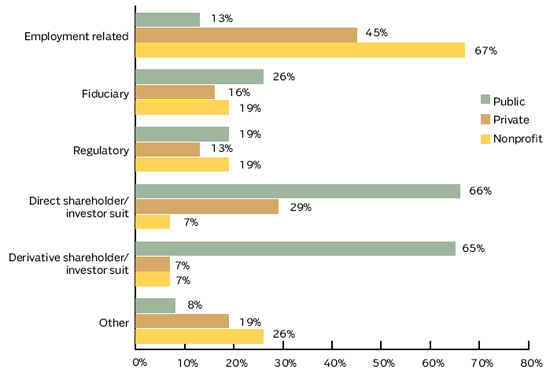
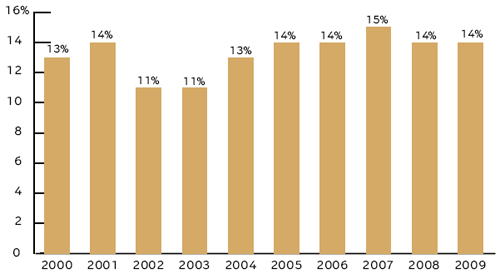
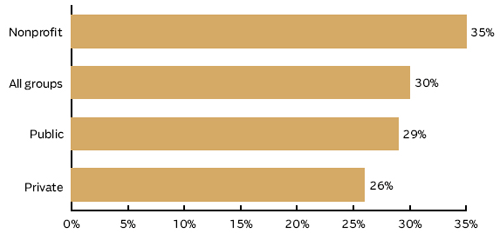
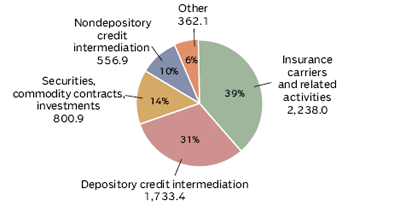
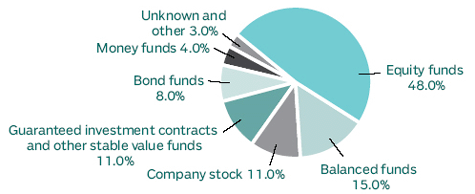
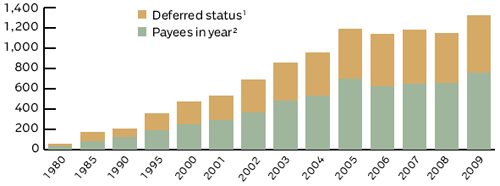
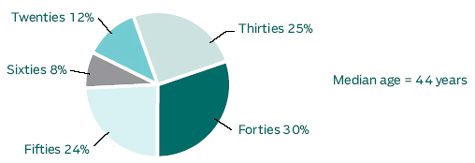
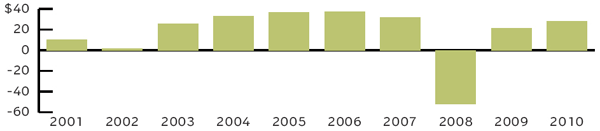
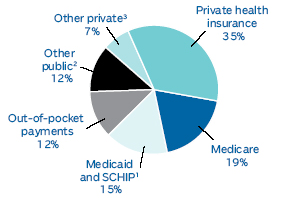
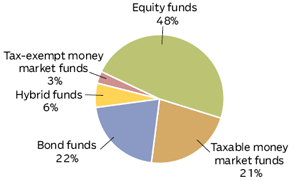
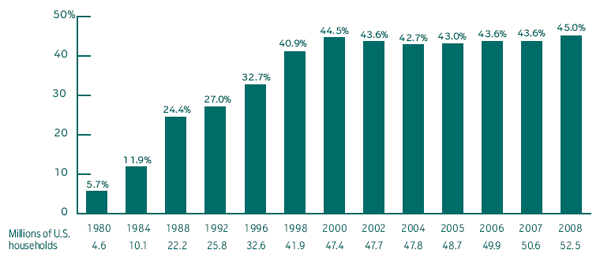
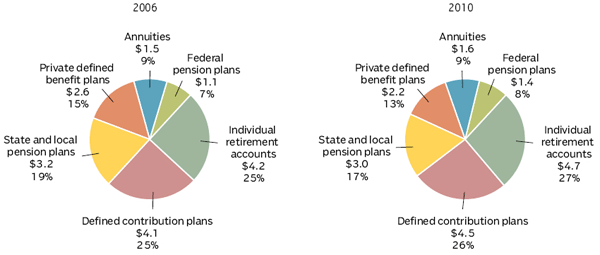
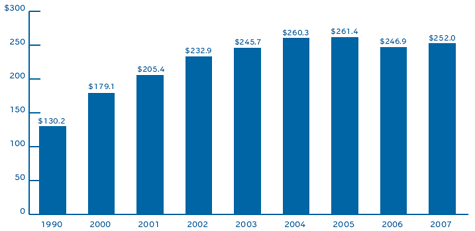

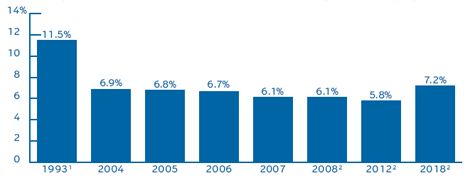
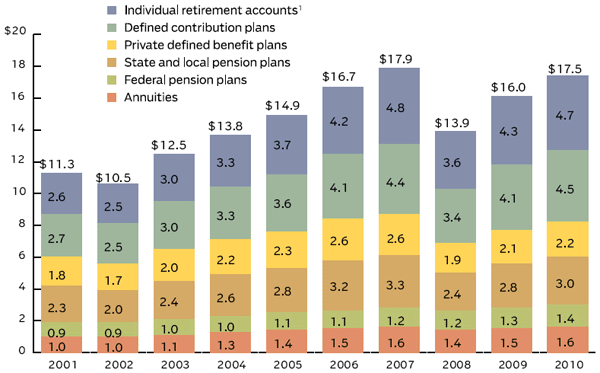
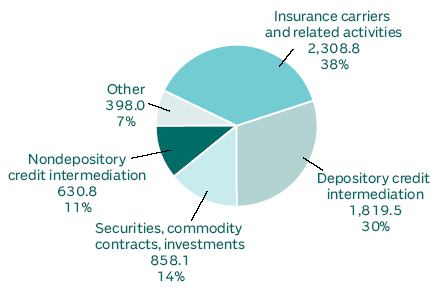
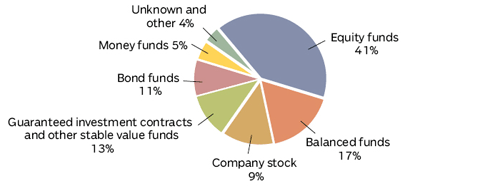
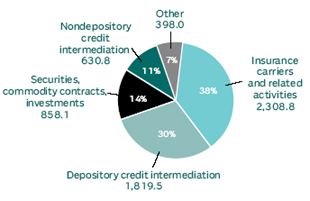
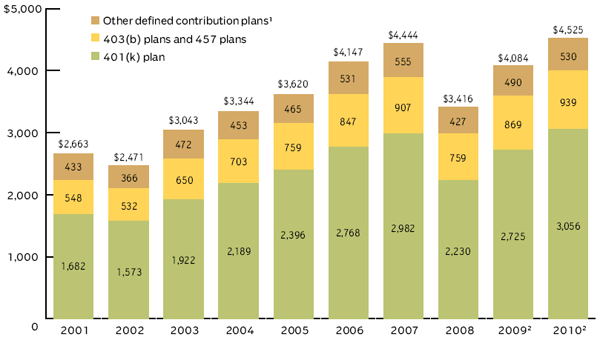

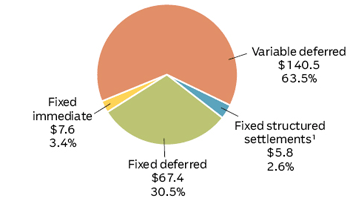


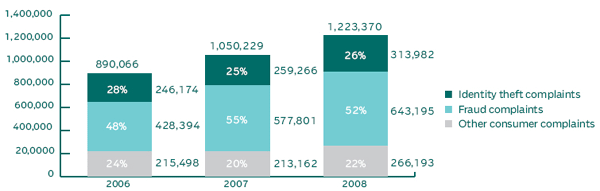
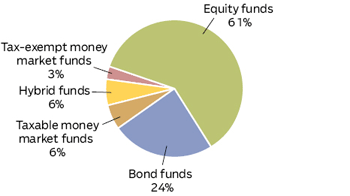
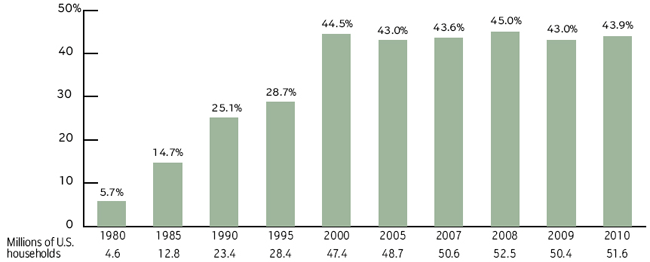
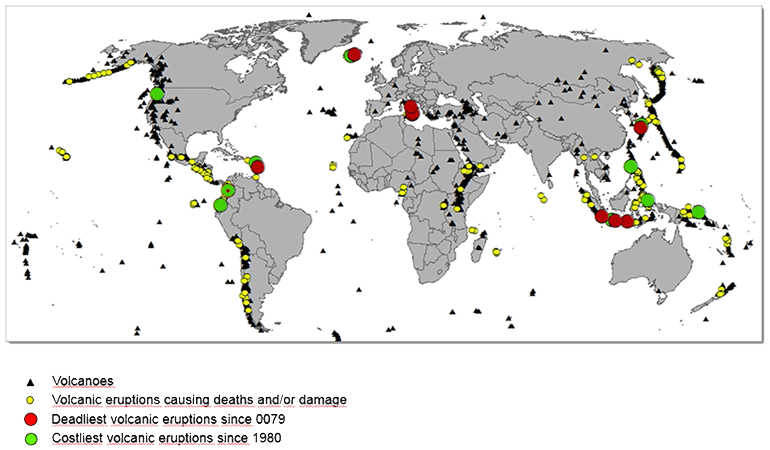
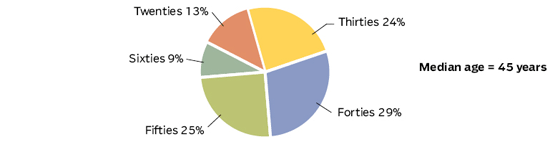
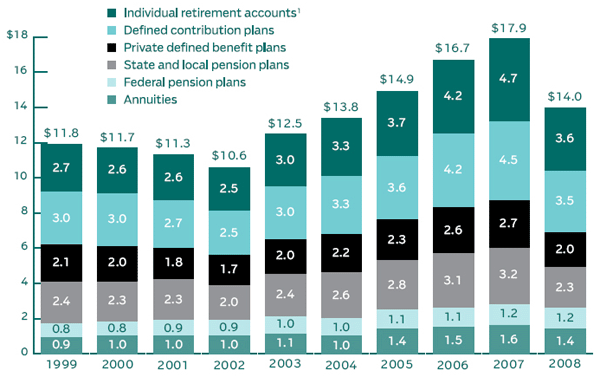
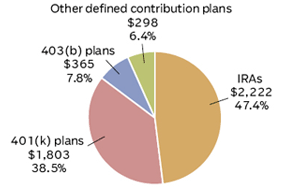

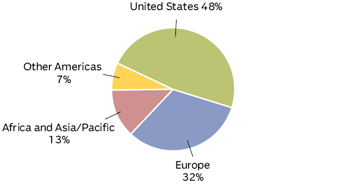
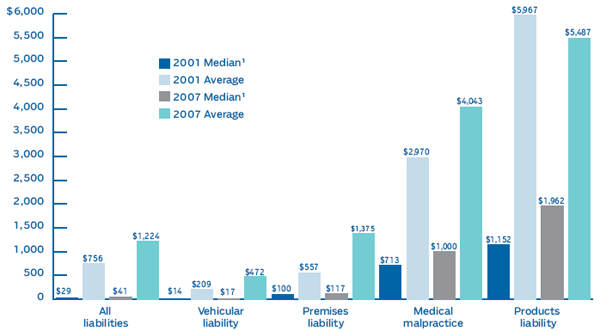
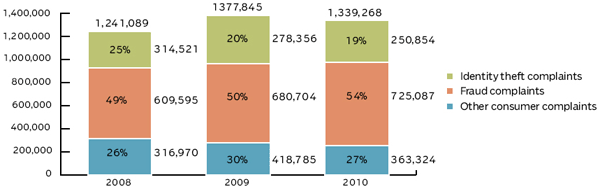
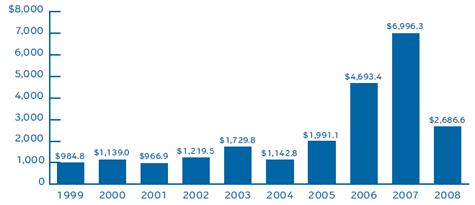
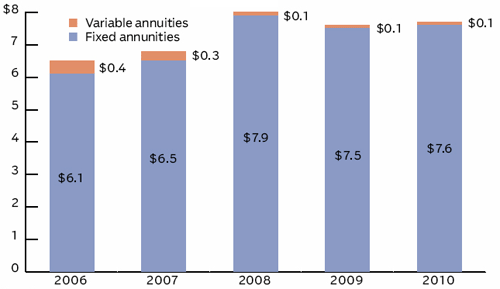
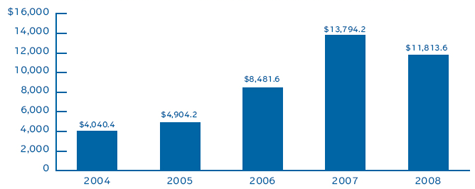
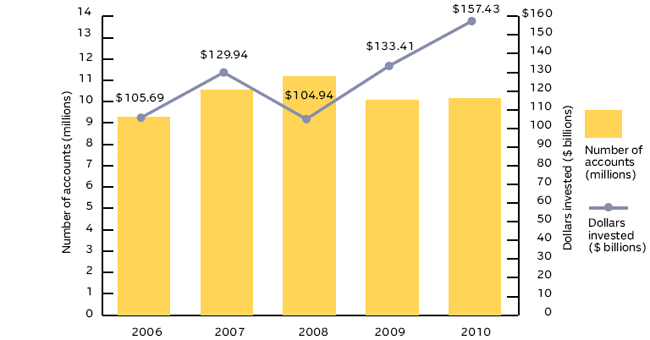
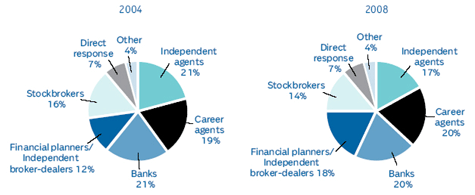
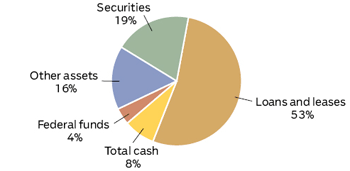
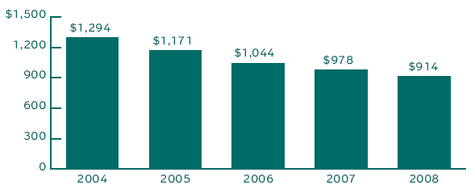
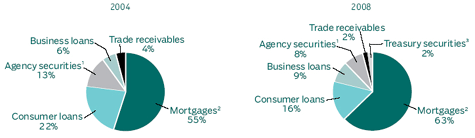
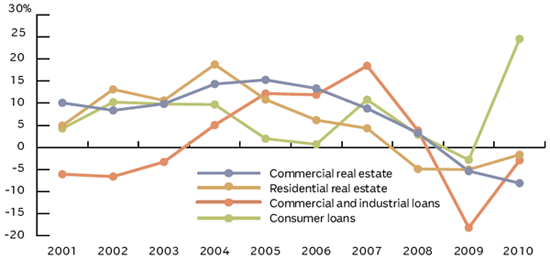
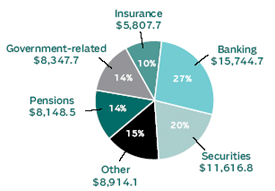
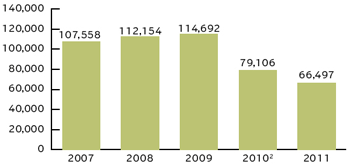
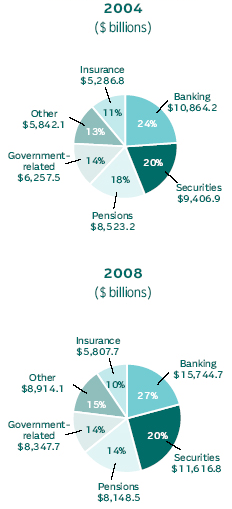
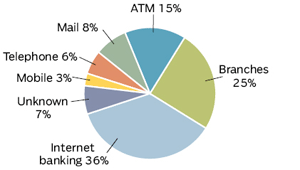
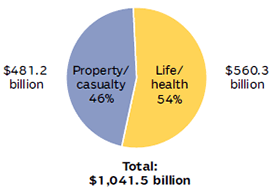

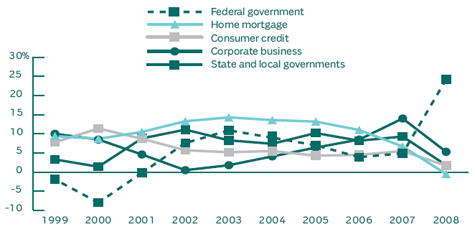
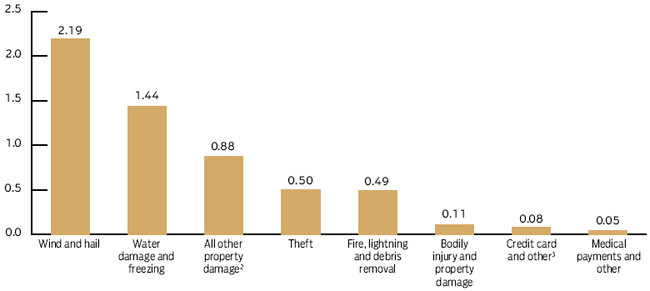
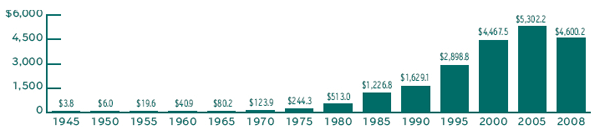

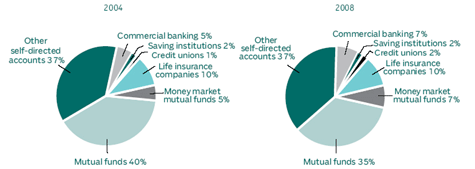
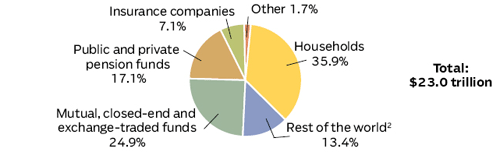

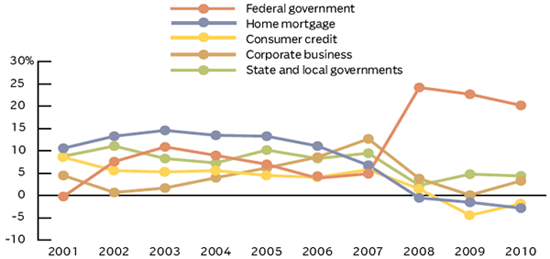

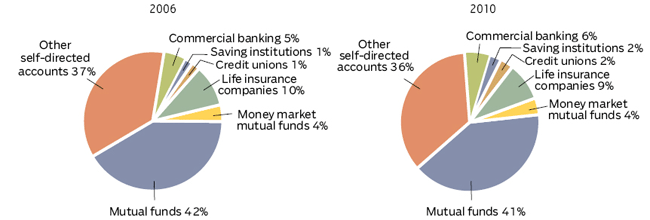
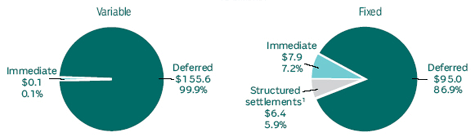
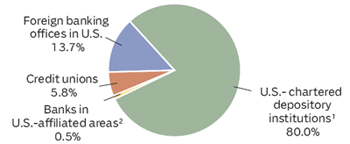
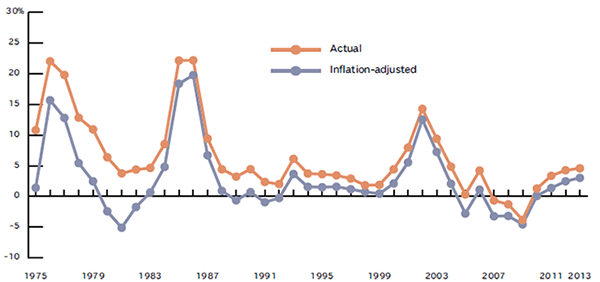
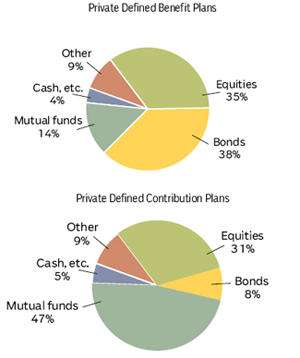
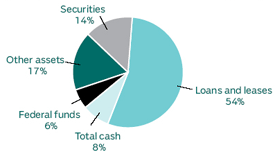
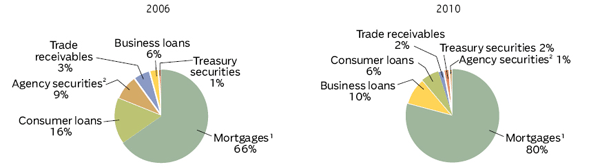

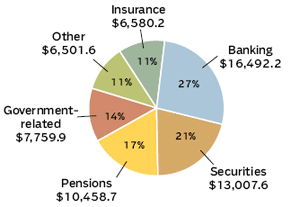
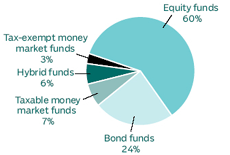
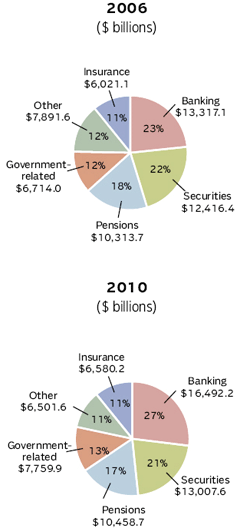
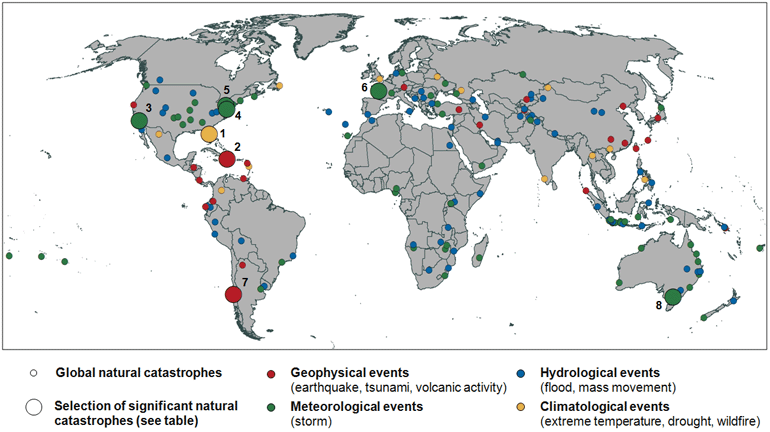
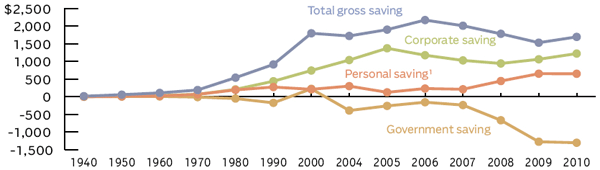
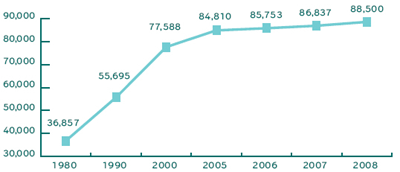
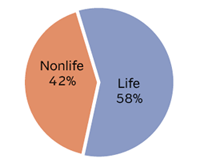

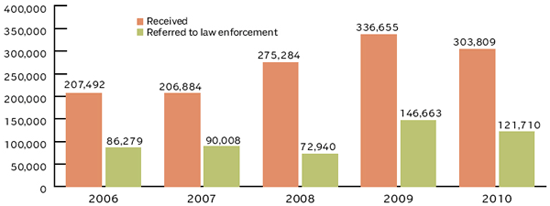
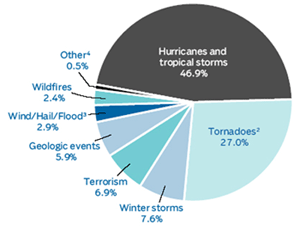
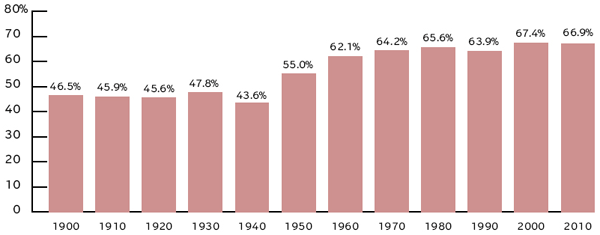
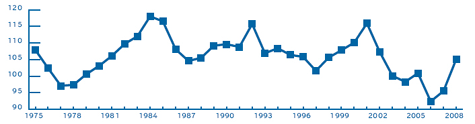
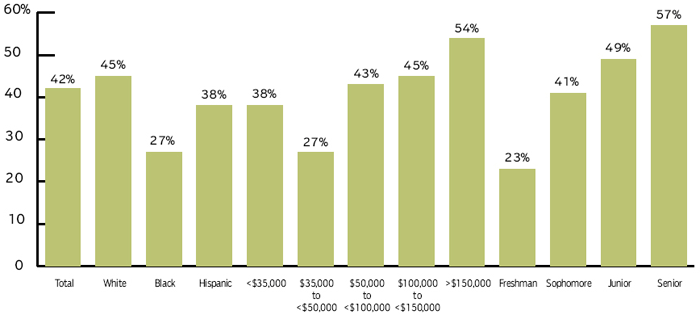
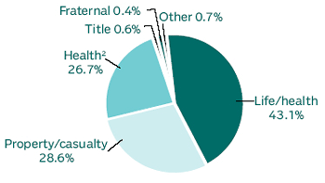
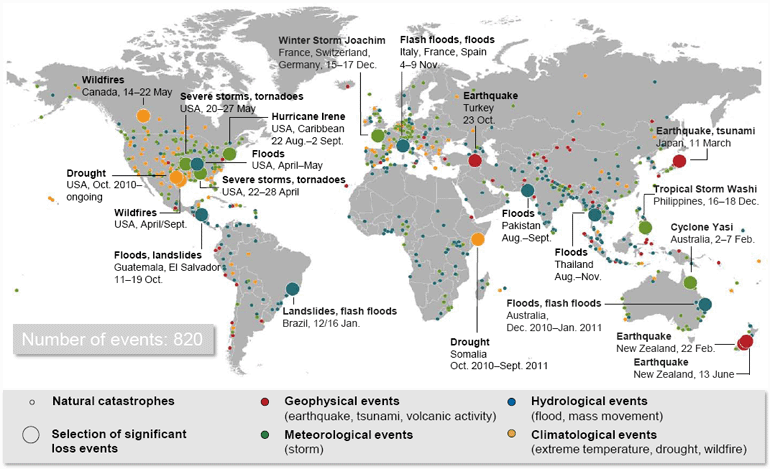
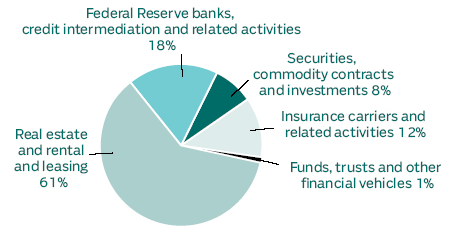
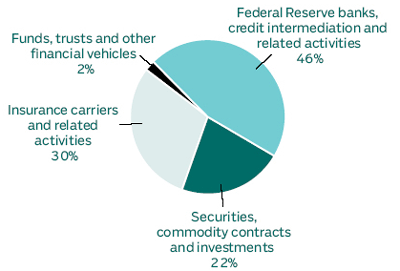
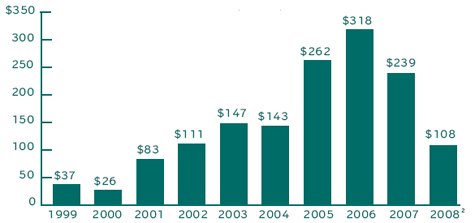

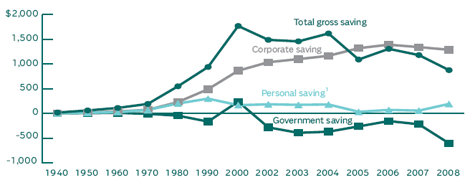

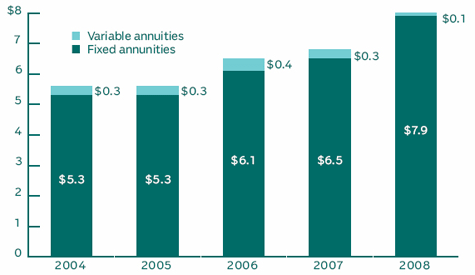
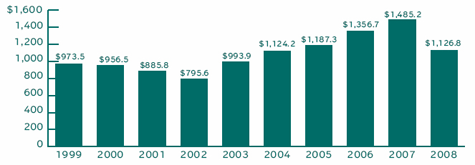

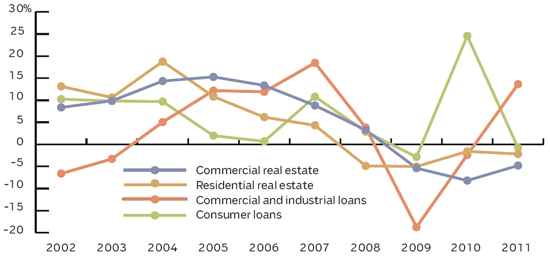
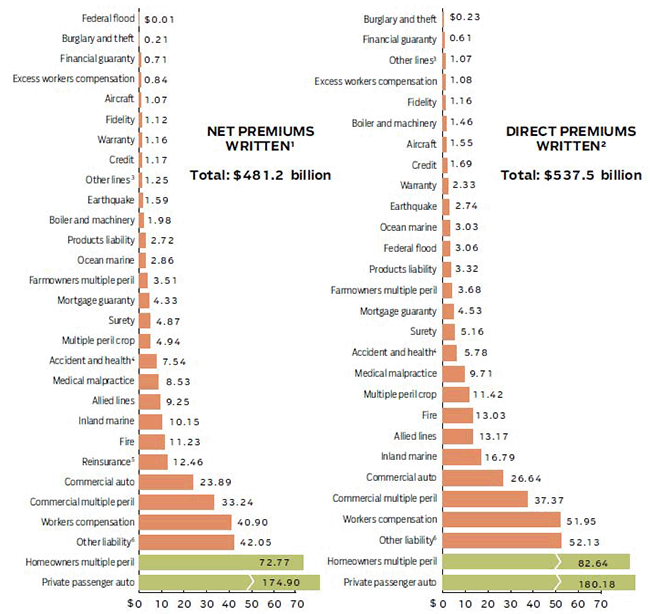

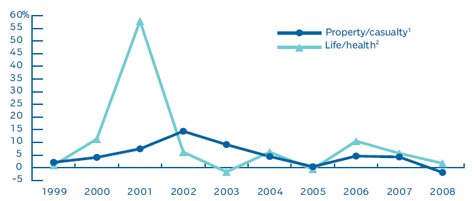
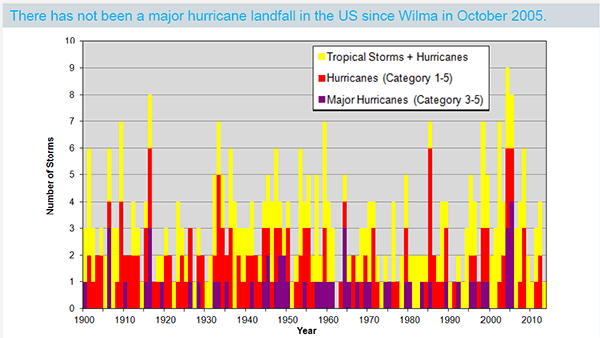
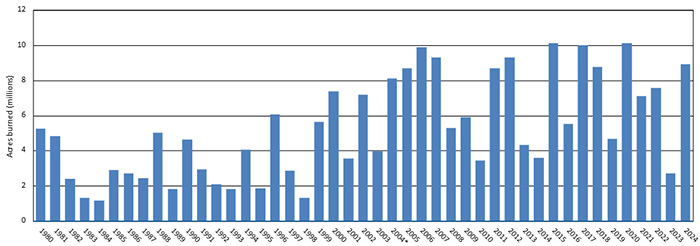
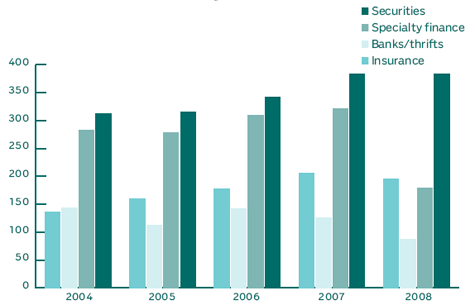
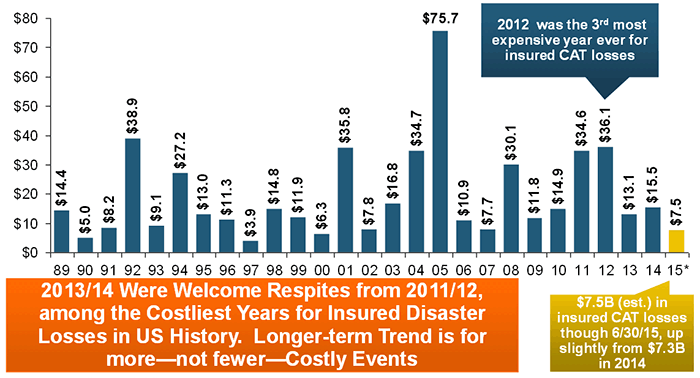
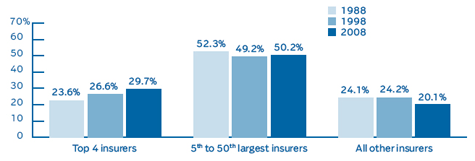
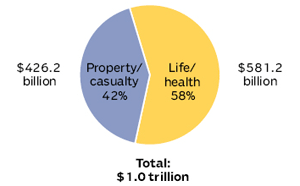
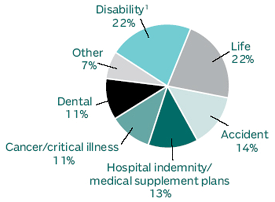
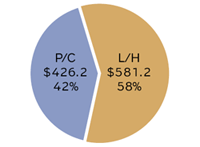
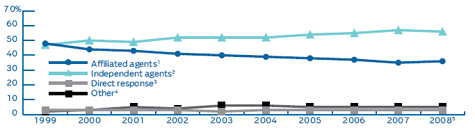
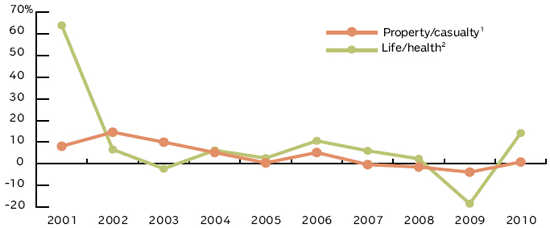
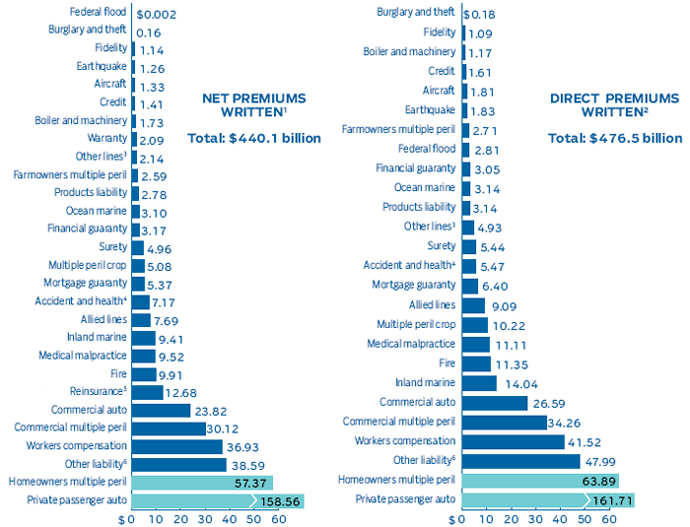
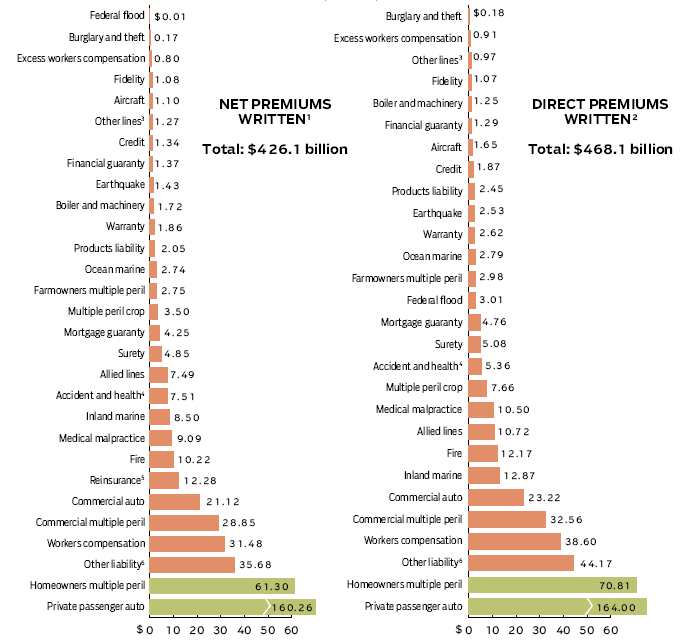
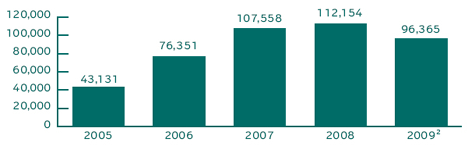
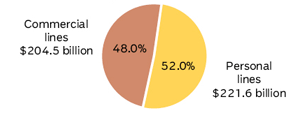

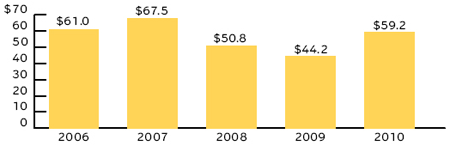
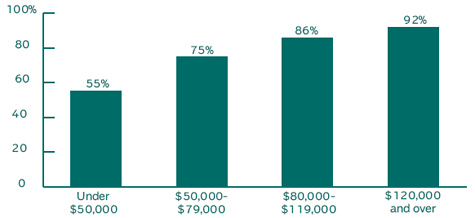
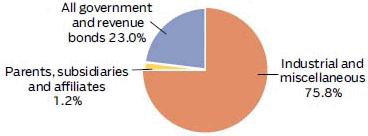
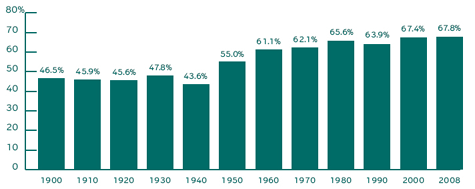
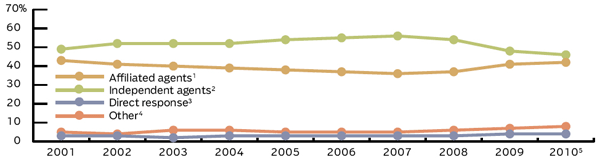
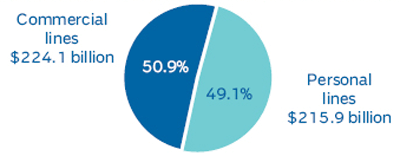
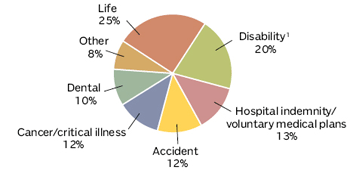
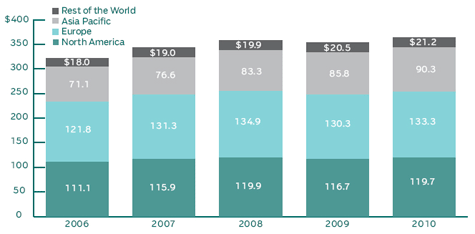
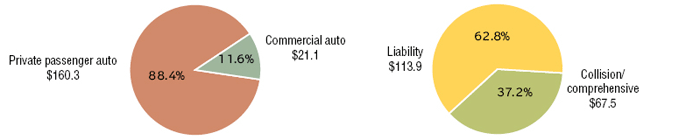

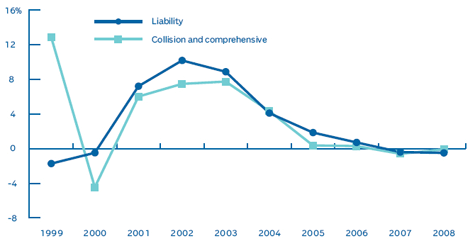

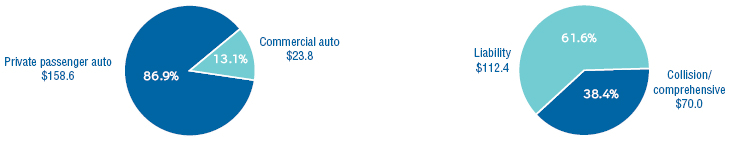
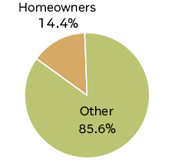
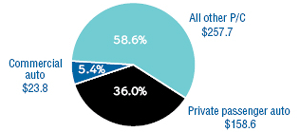
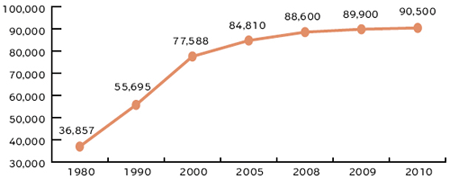
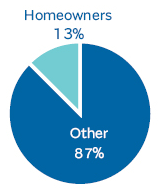
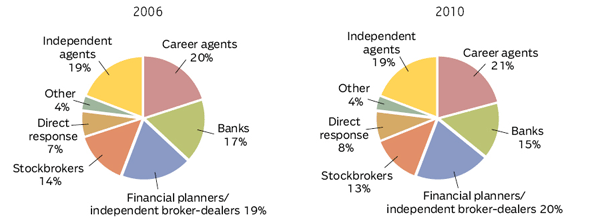
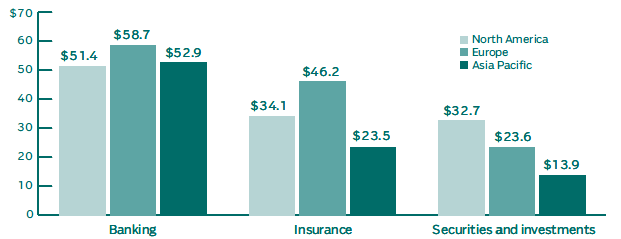
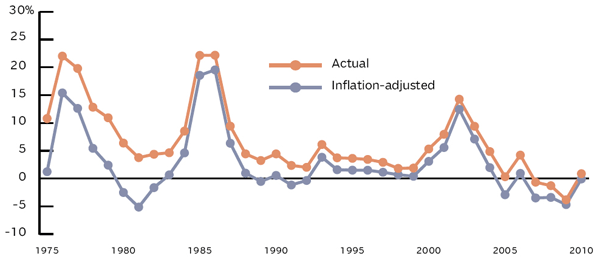
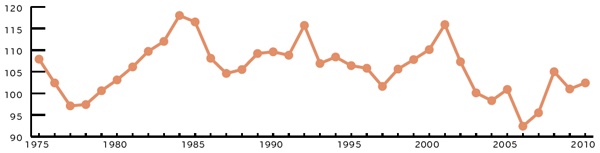
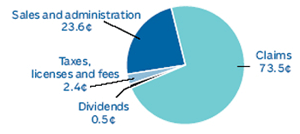
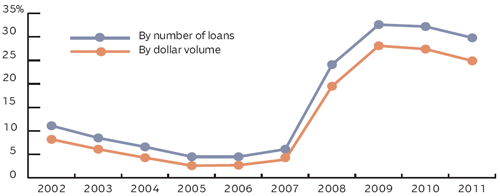
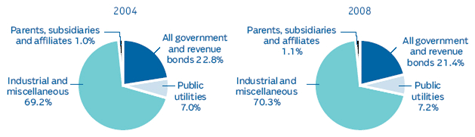
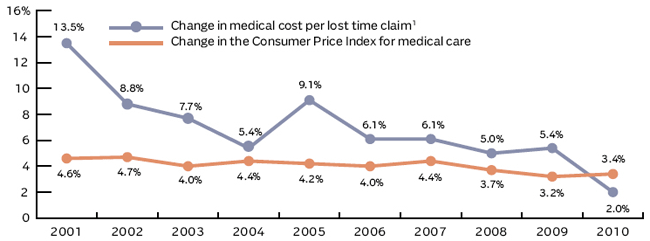
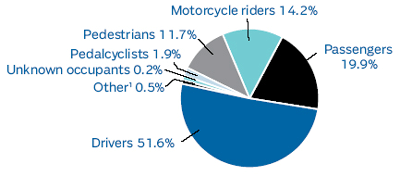
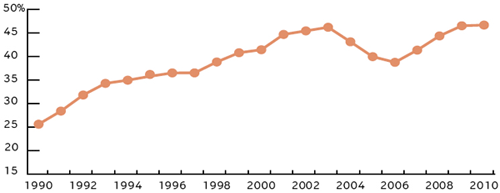
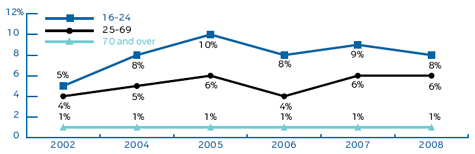
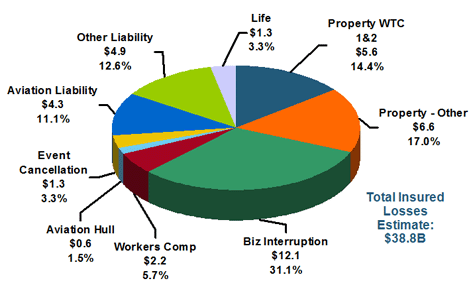
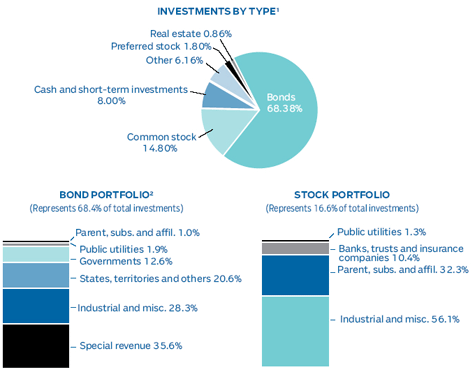
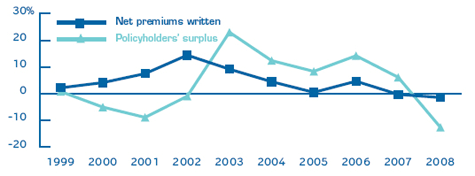
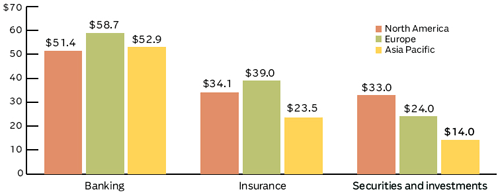
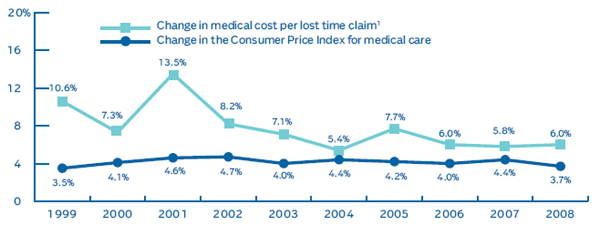
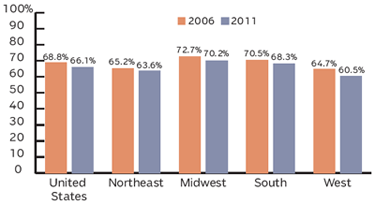
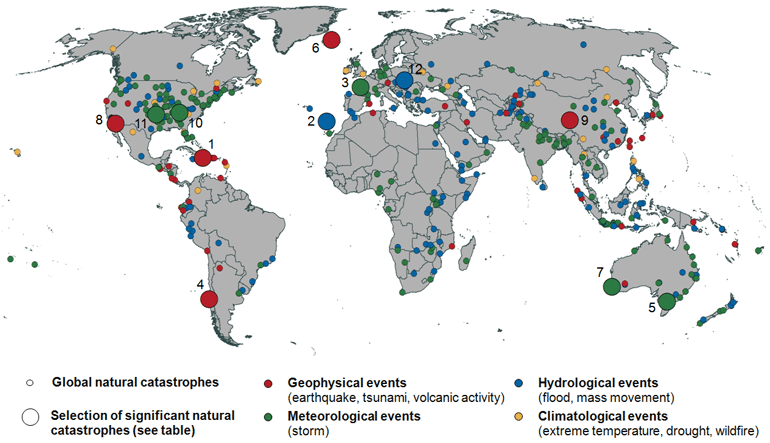
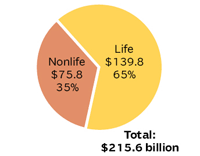
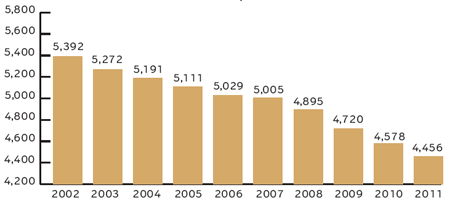
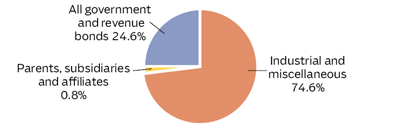
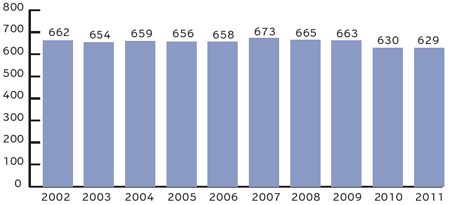
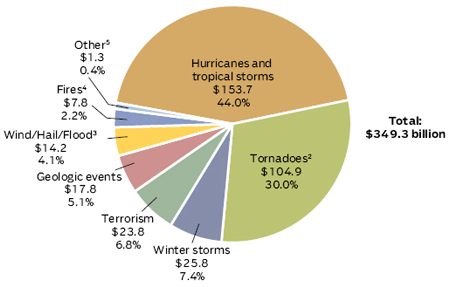
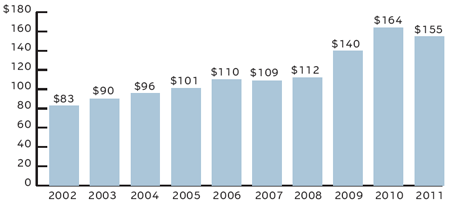
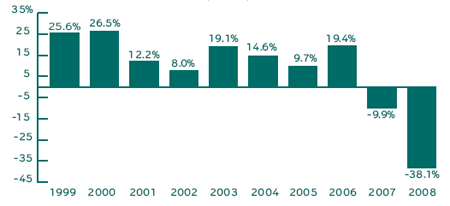
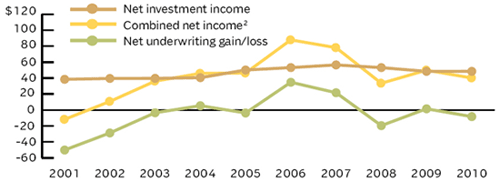
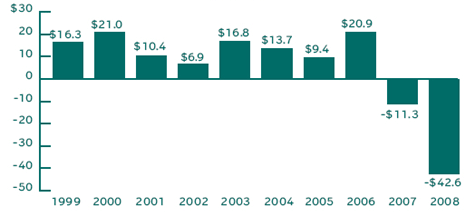
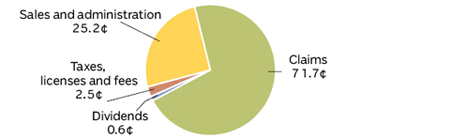
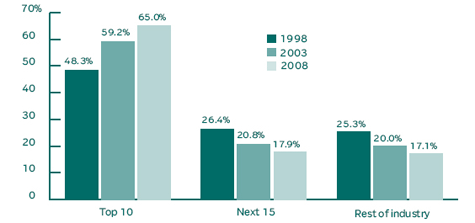
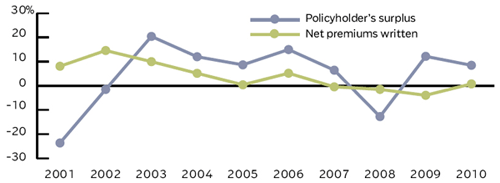
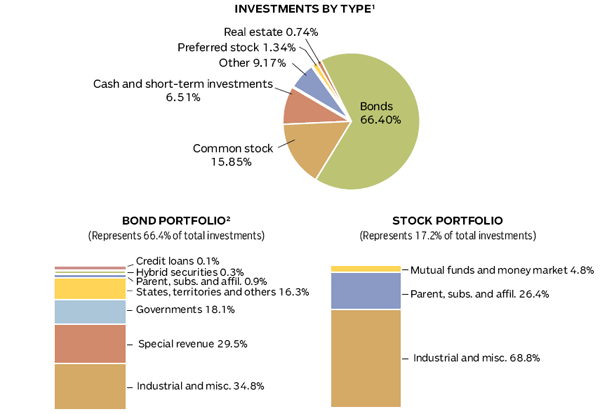
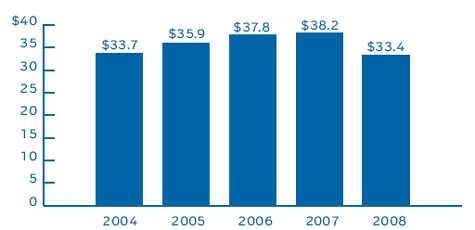
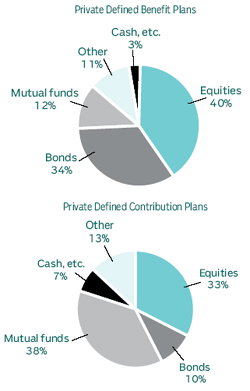
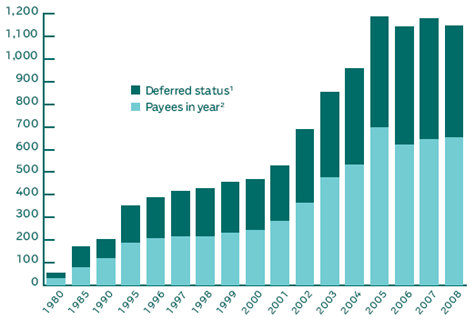
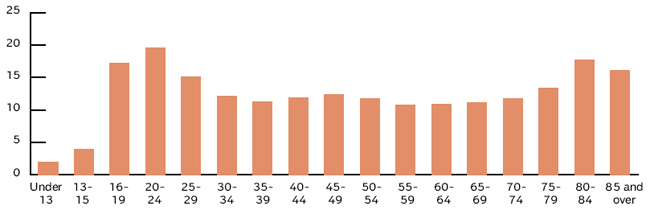
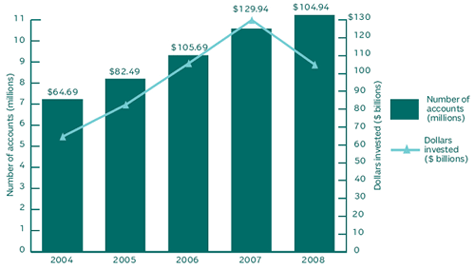
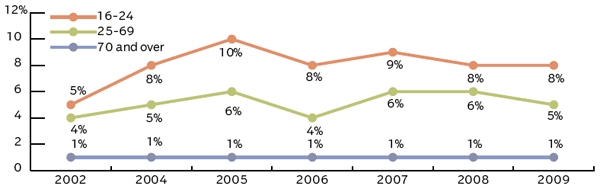
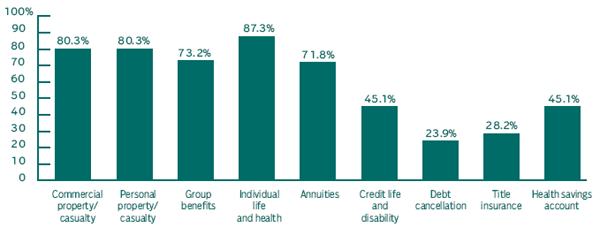
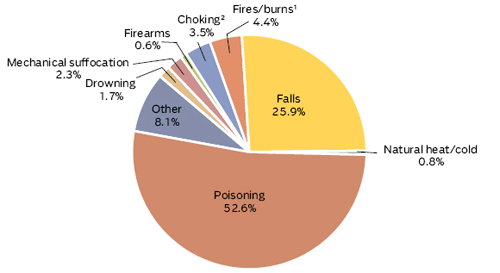
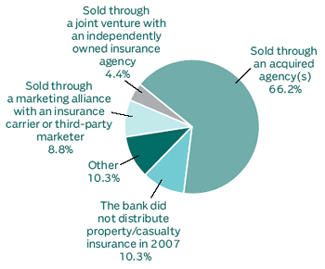
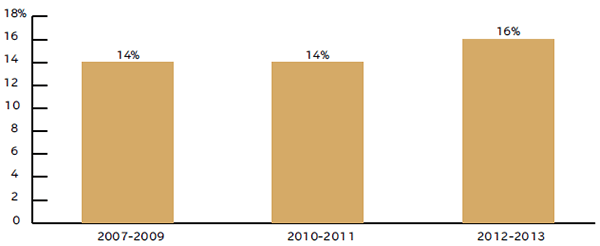
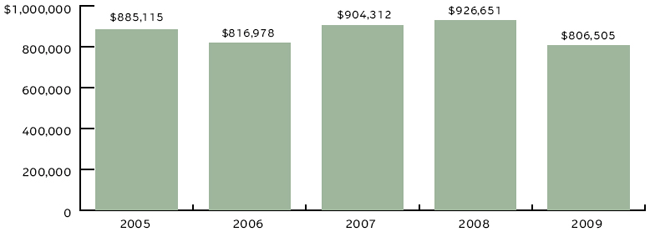
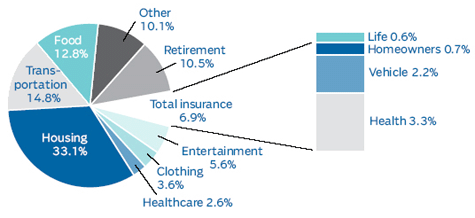
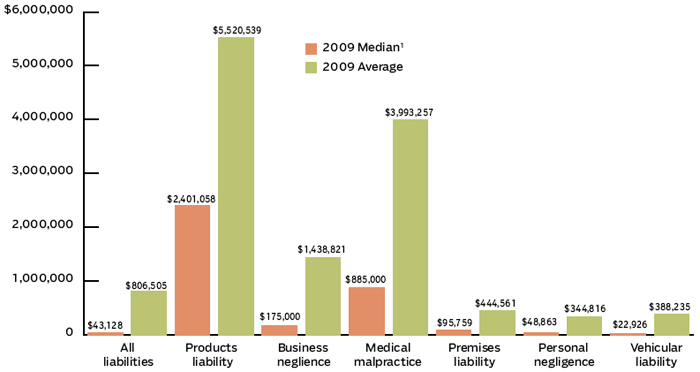
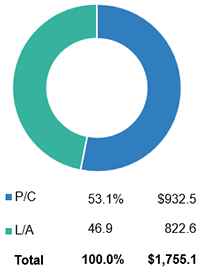
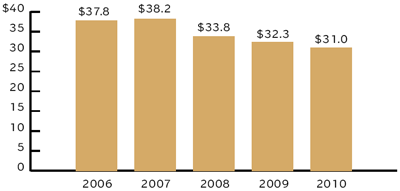
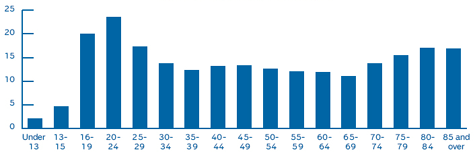
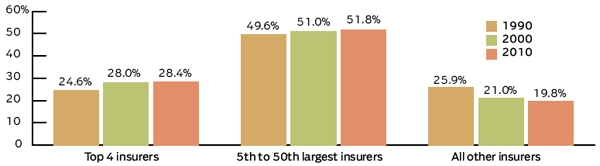
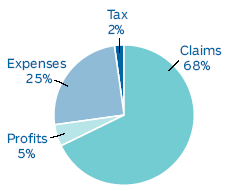
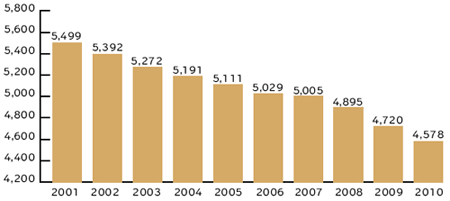
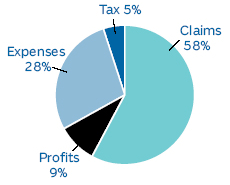
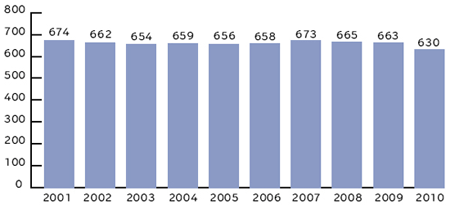
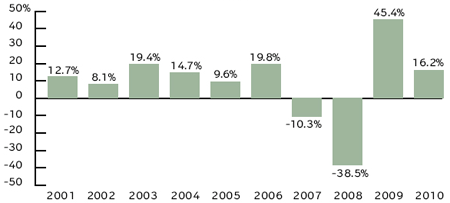
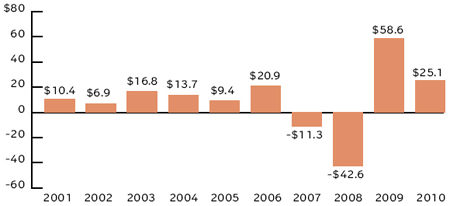
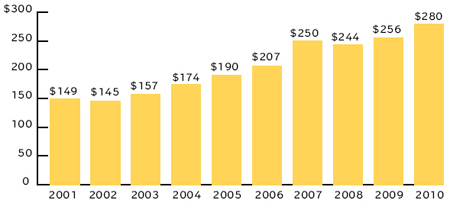
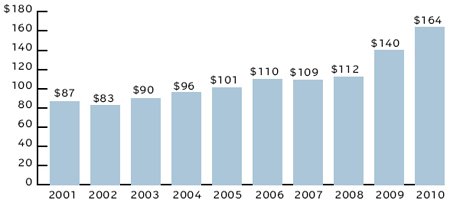
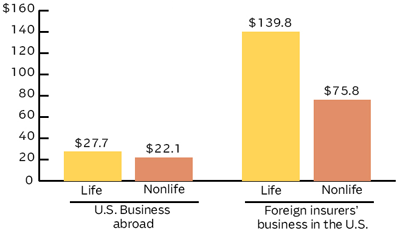
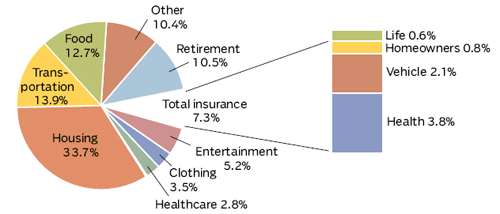
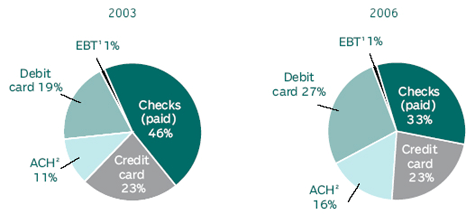
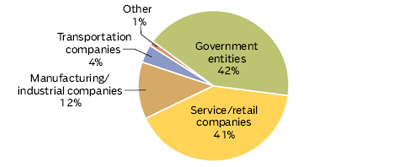
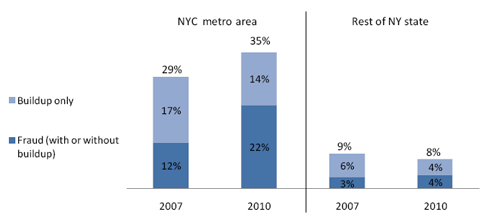
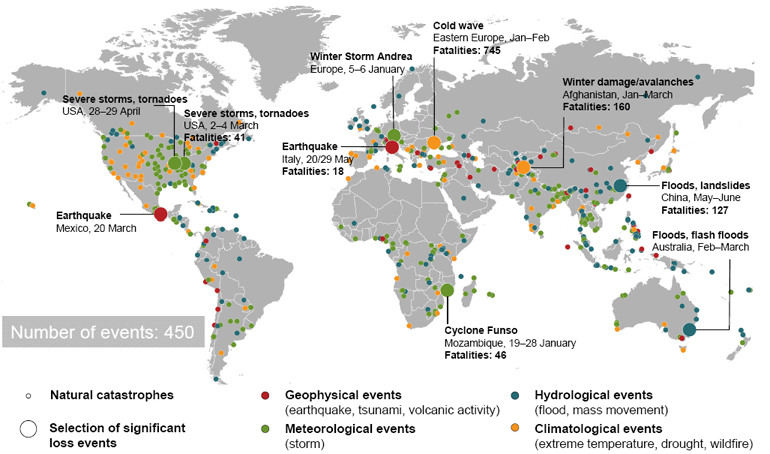
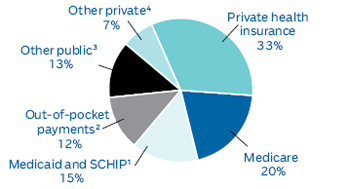
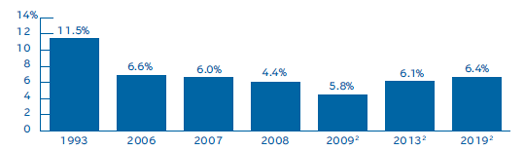
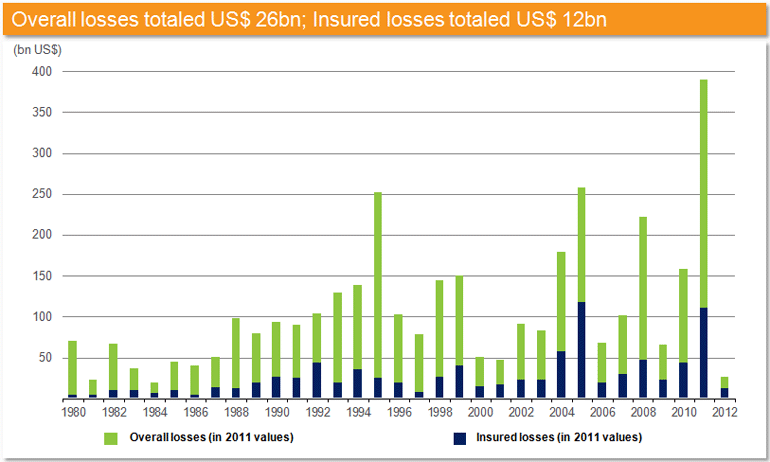
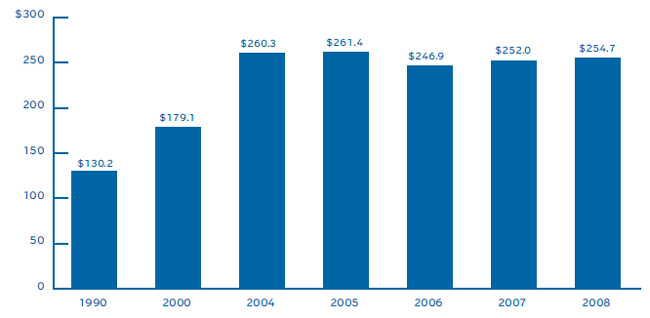
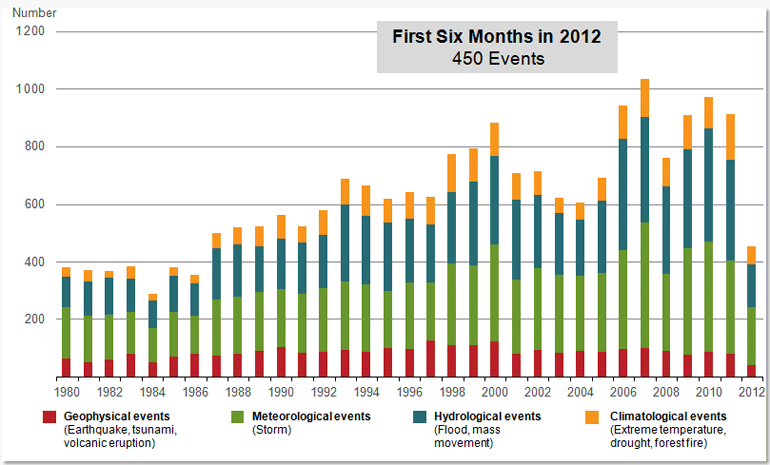
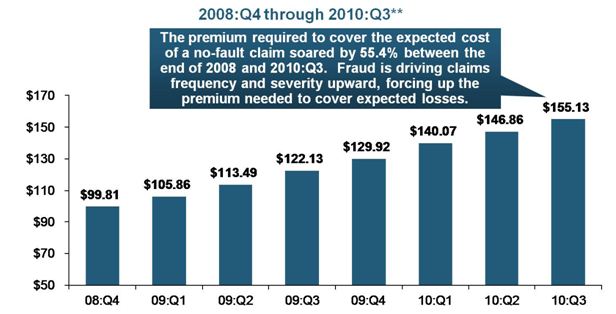
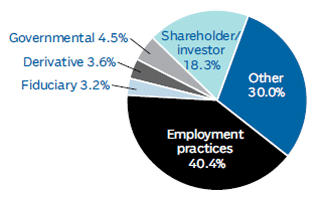
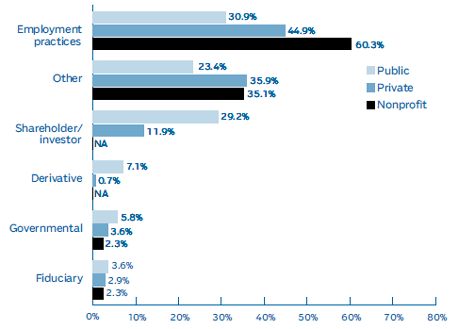
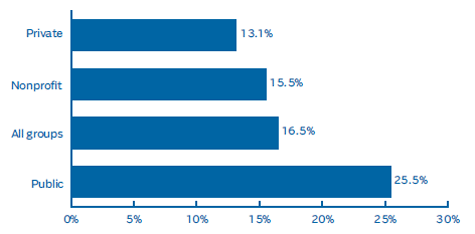
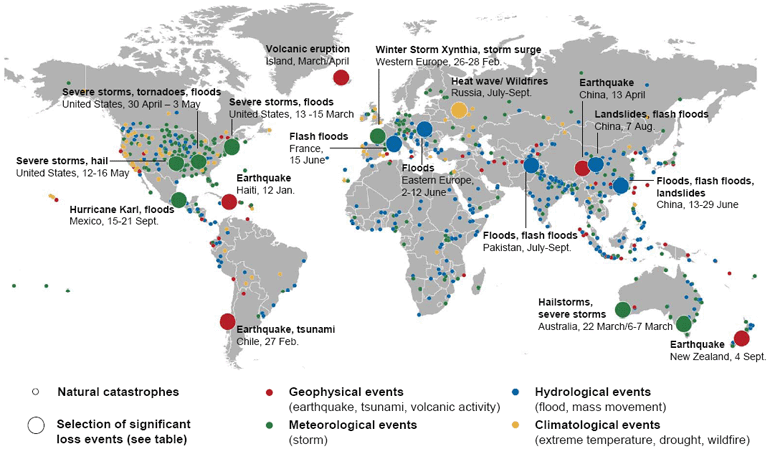

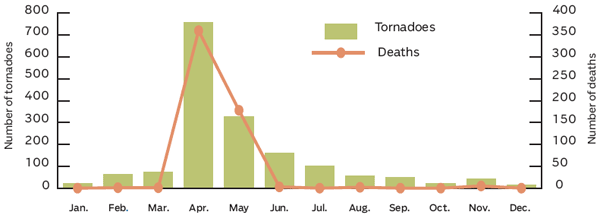

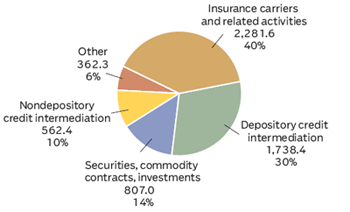
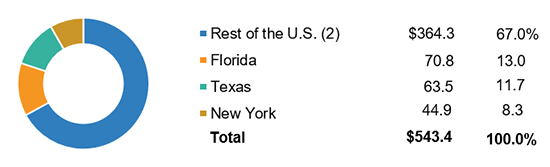
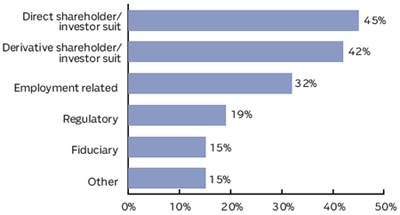
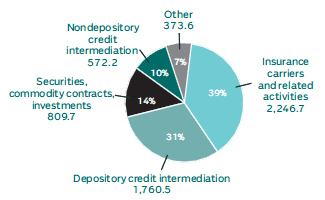
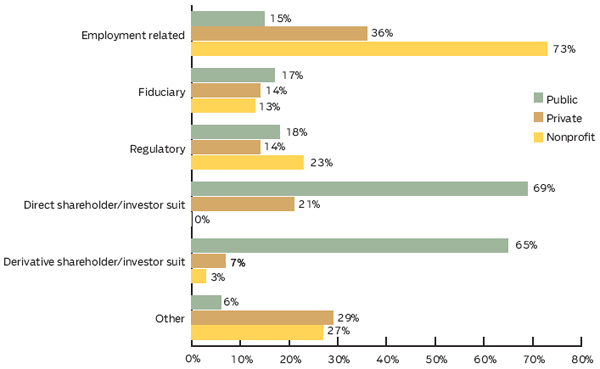
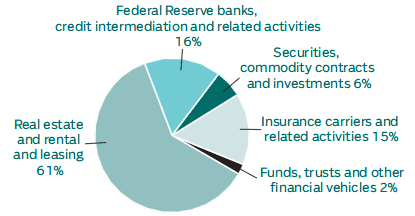
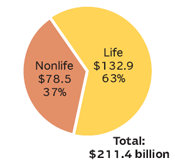
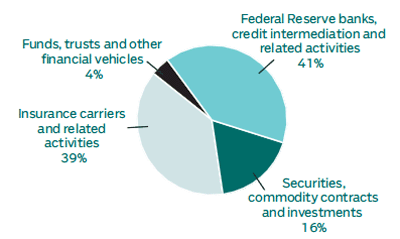
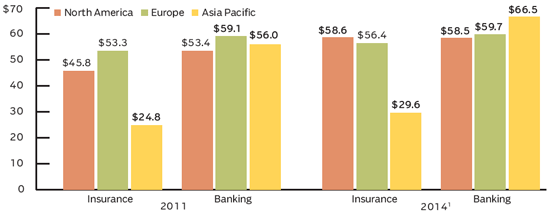
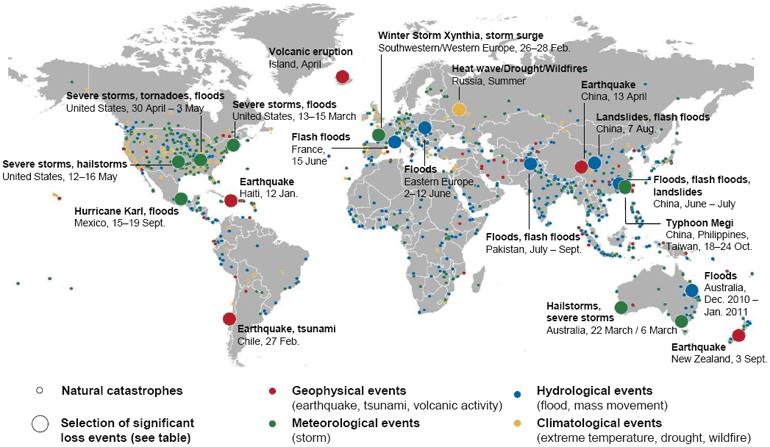
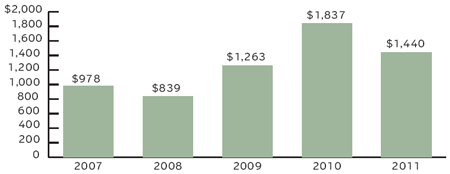
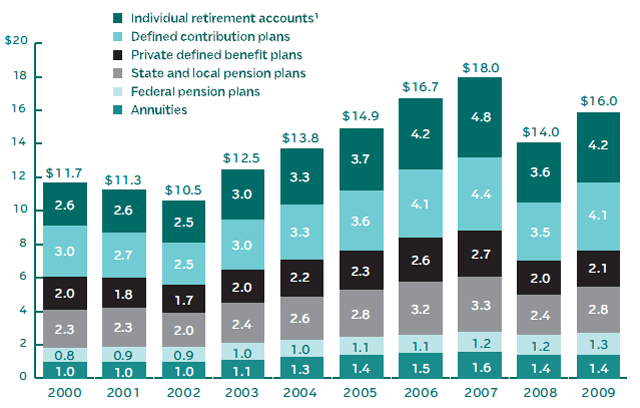
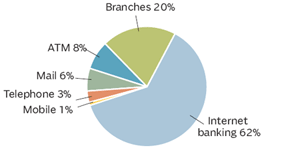
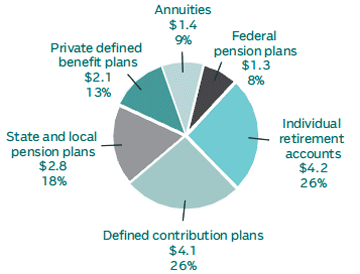
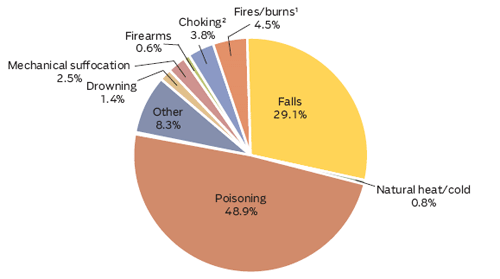
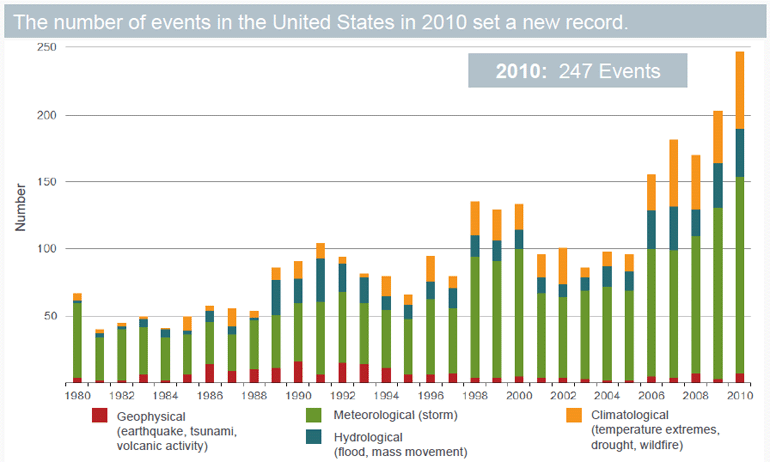

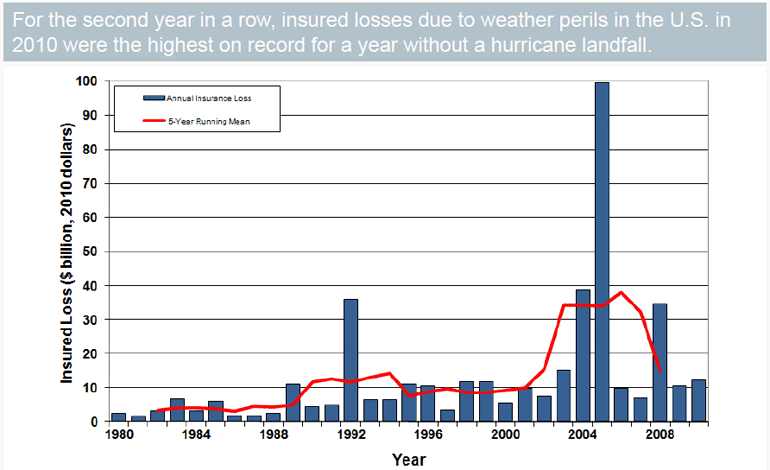

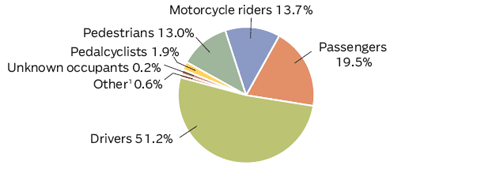
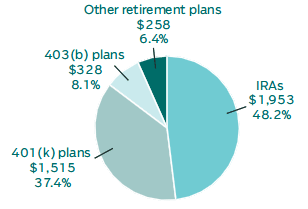
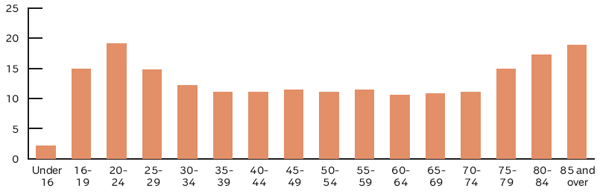
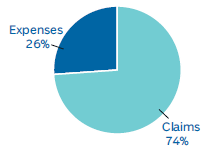
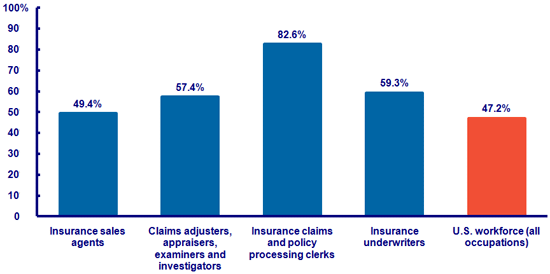
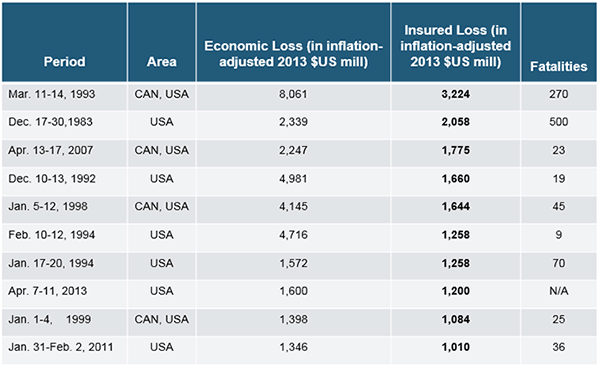
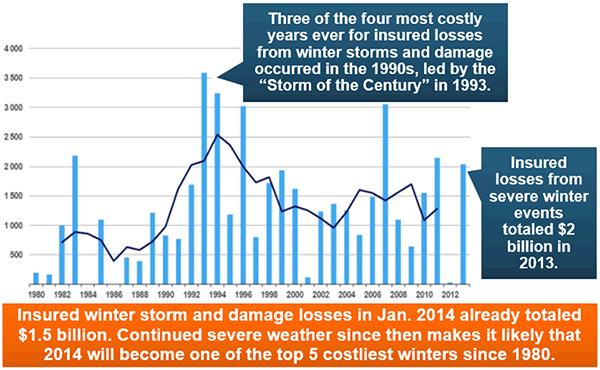

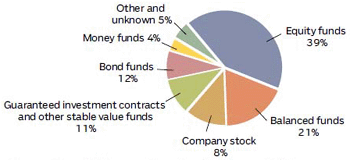
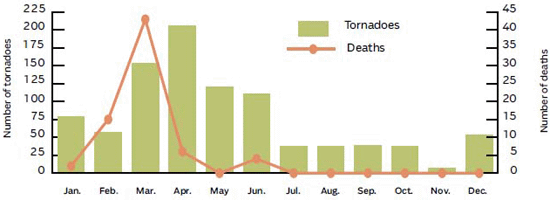
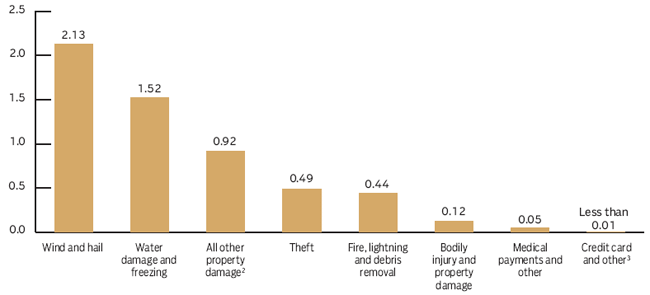
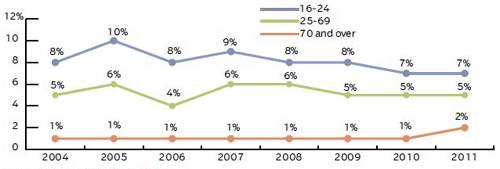
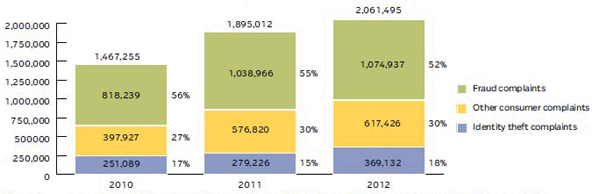
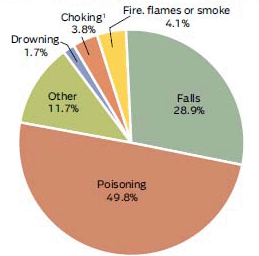
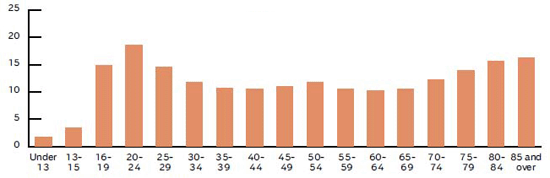
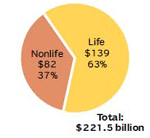
")
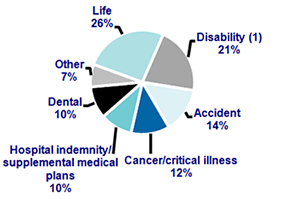
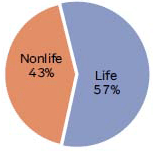
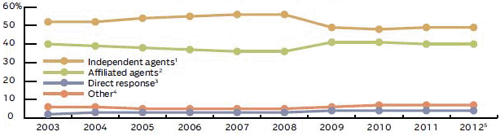
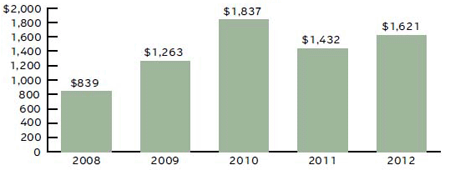
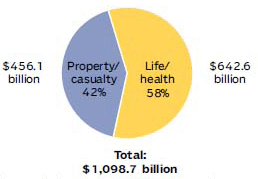
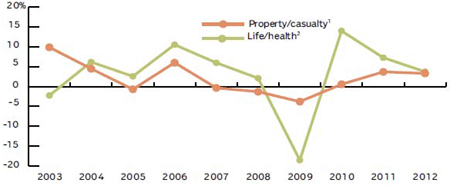
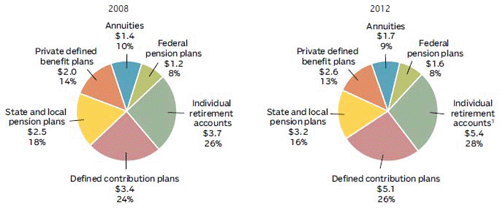
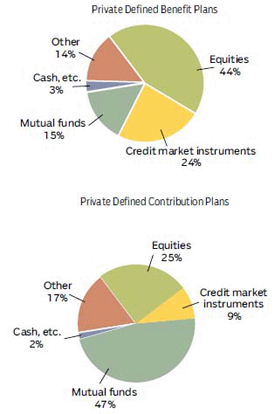
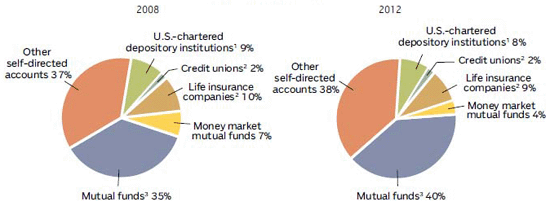
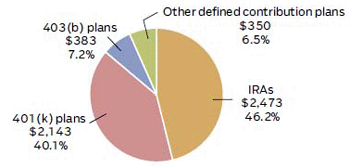
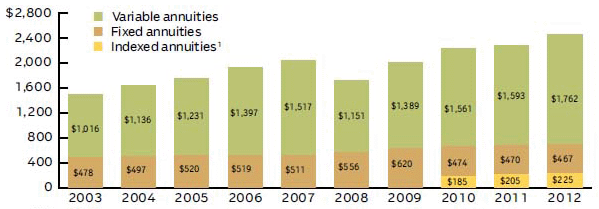
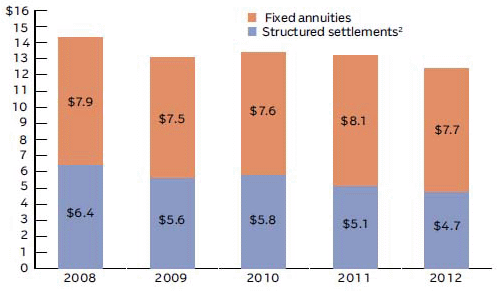
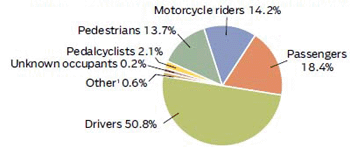
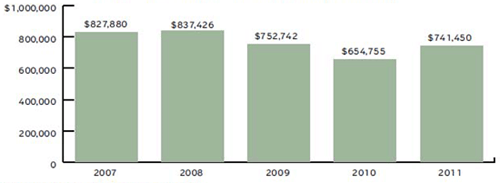
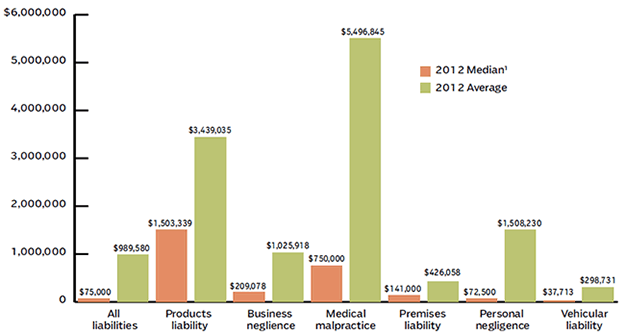
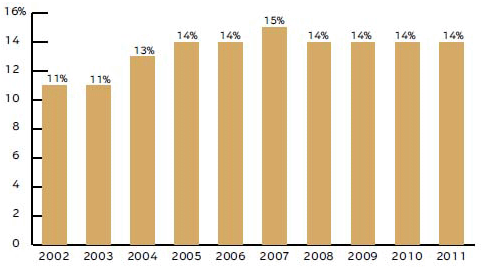
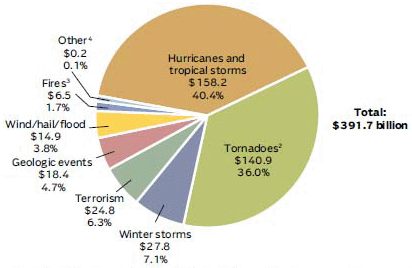
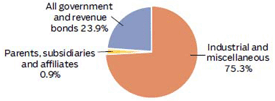

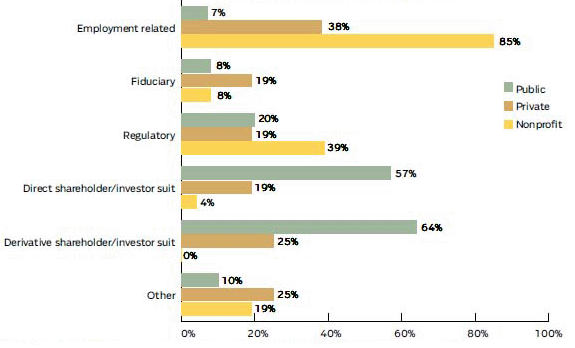

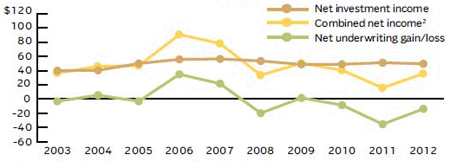
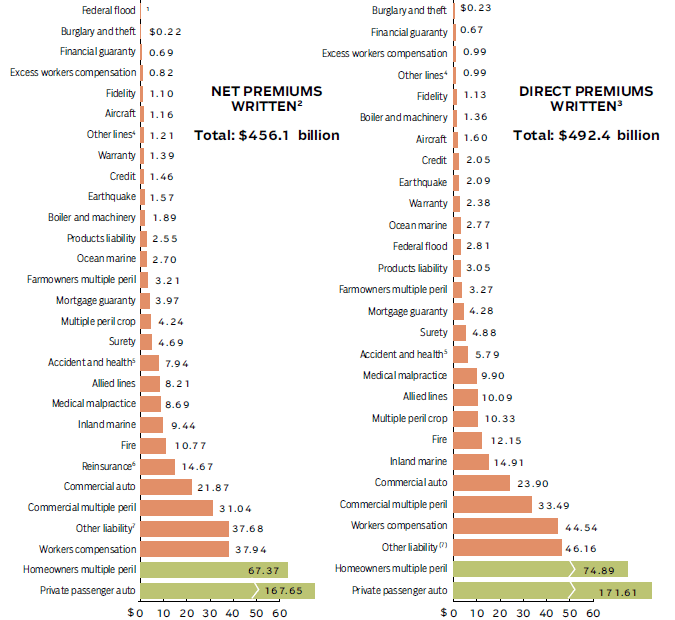
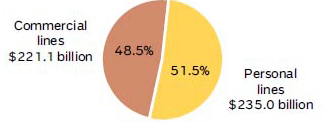

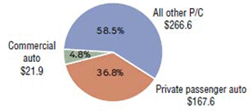
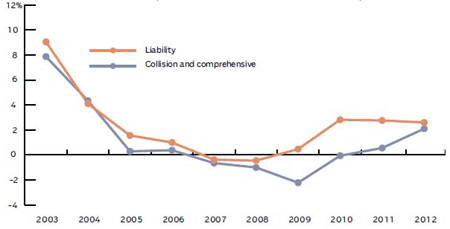
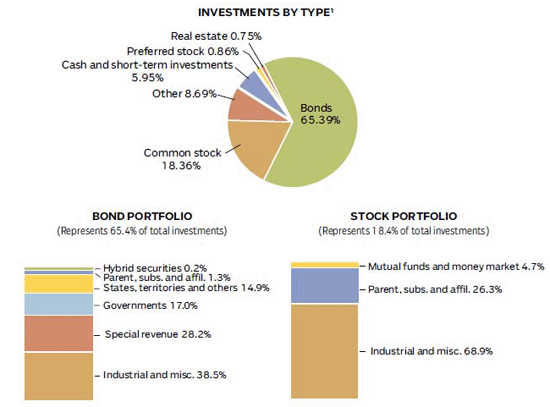
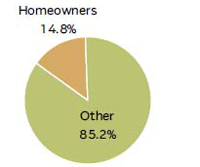
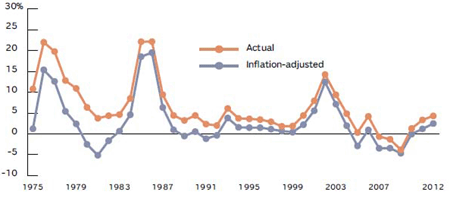
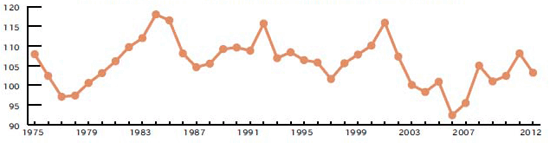
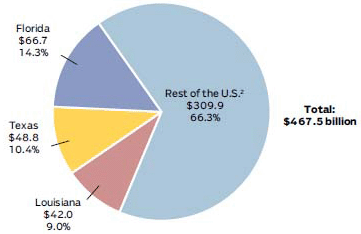
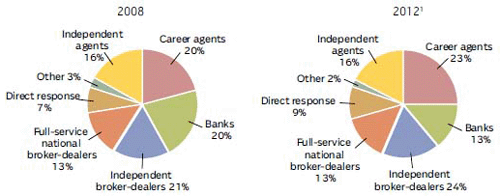
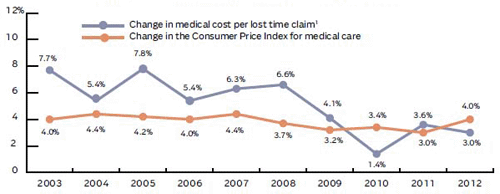


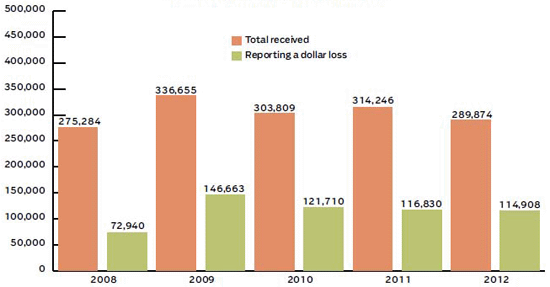
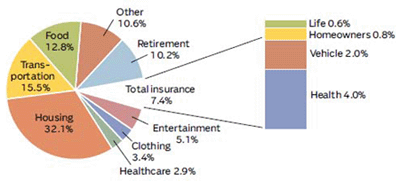
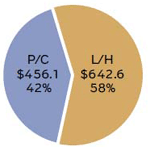
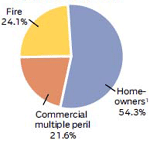
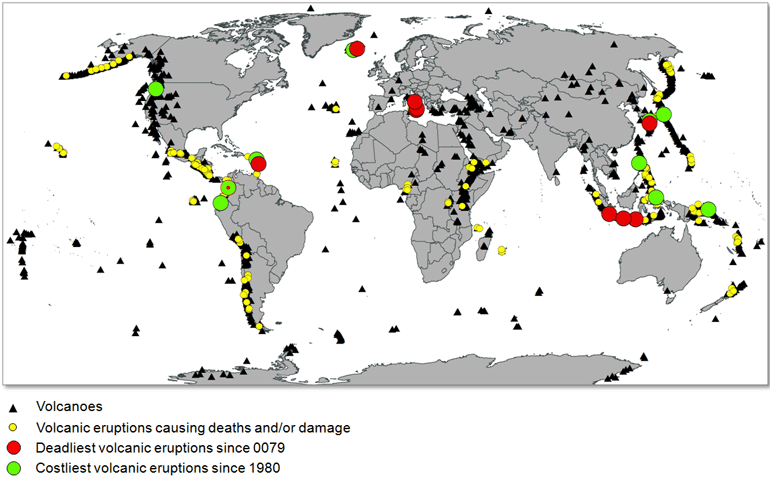
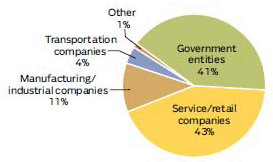
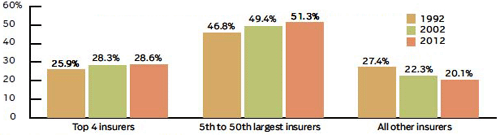
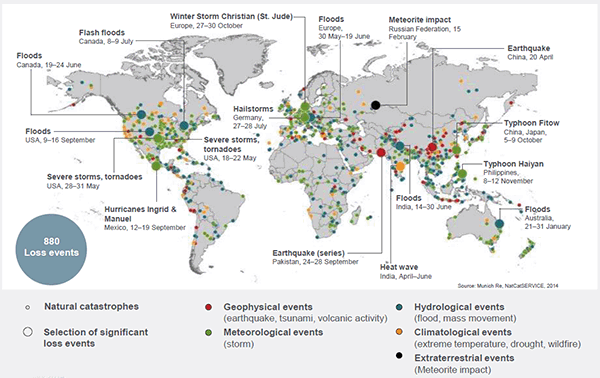
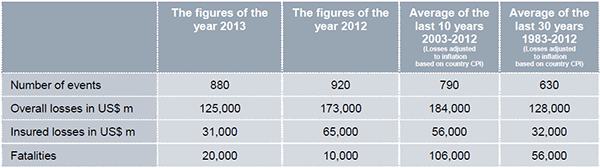

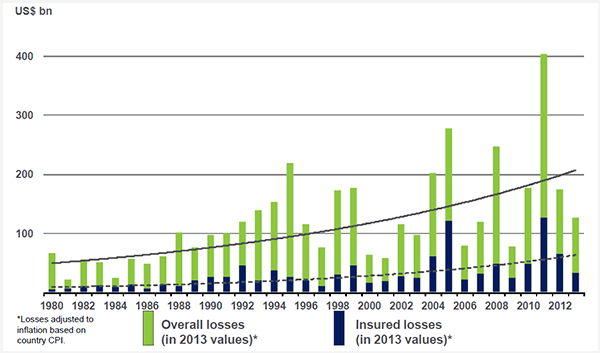
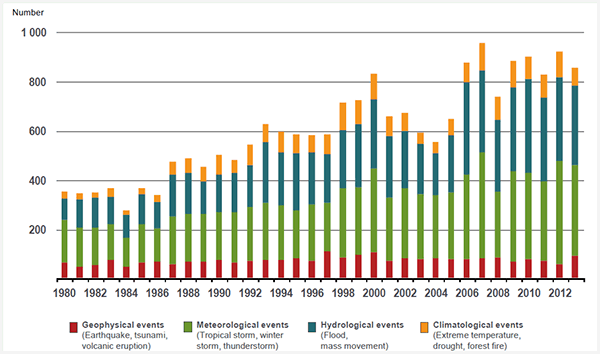
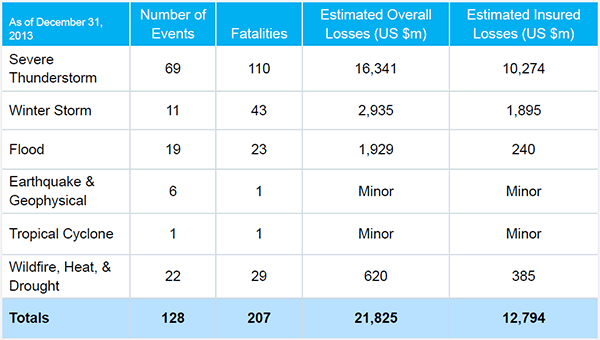
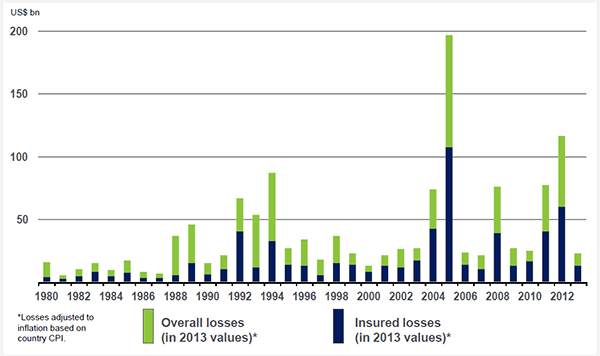
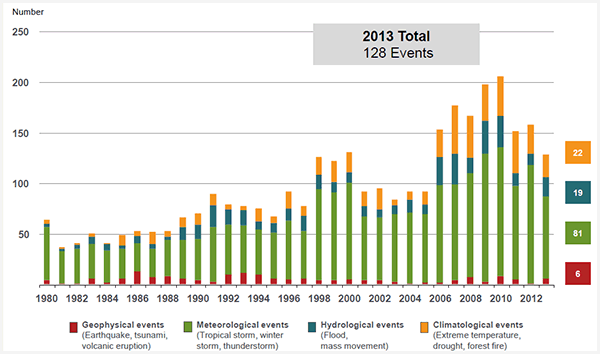
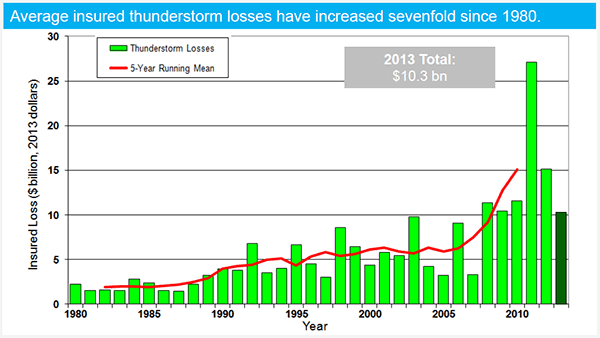
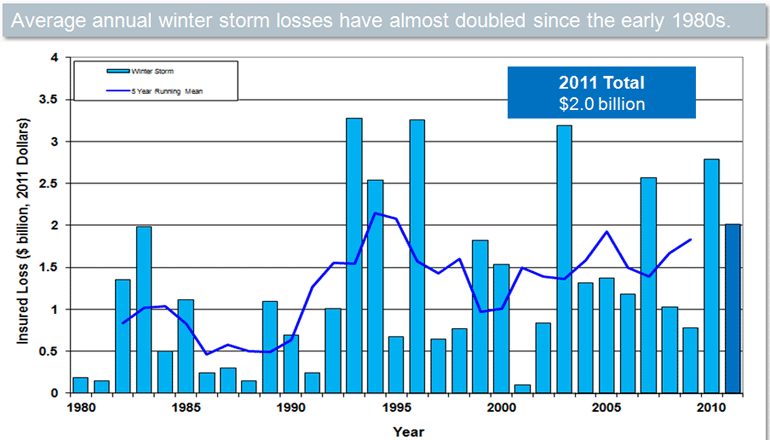
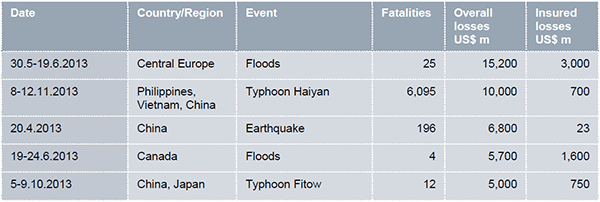
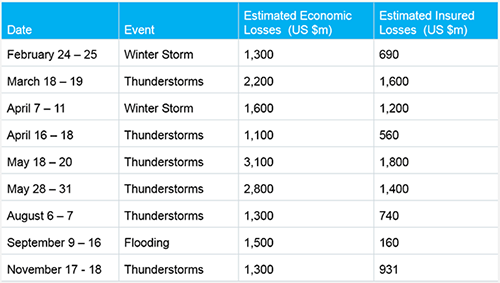
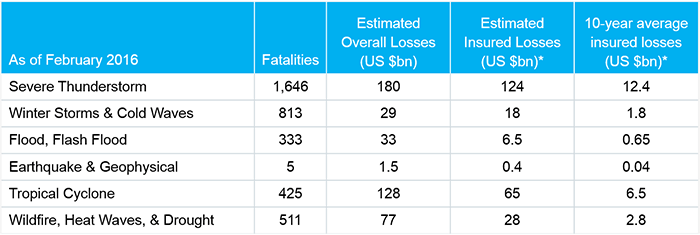
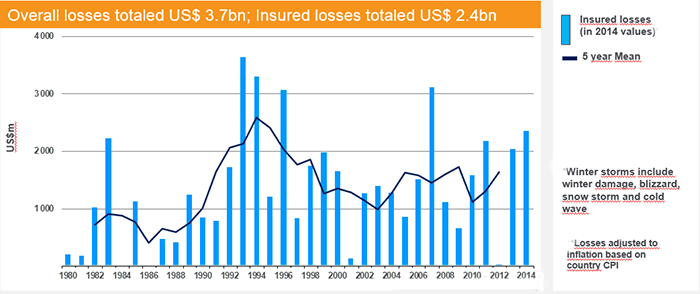
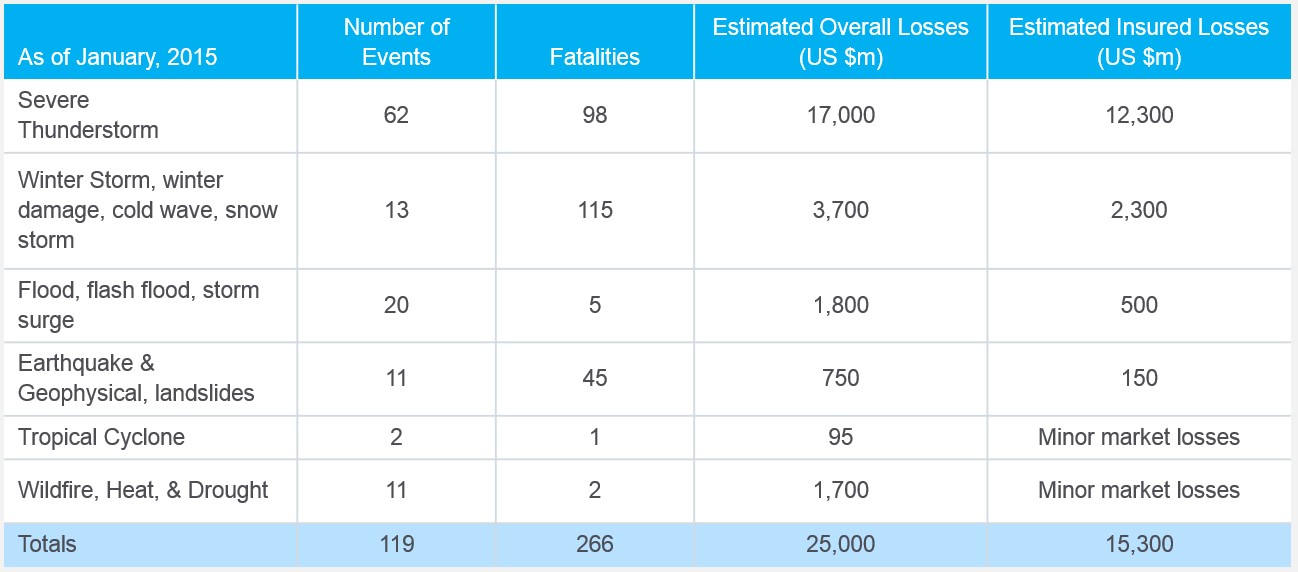
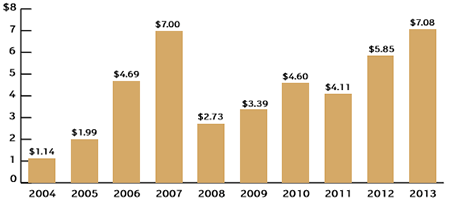
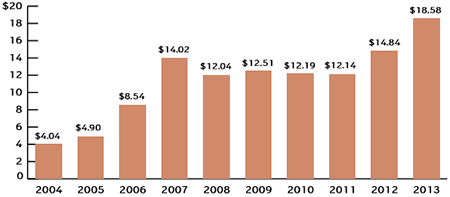
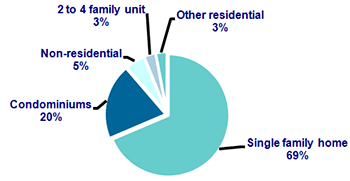
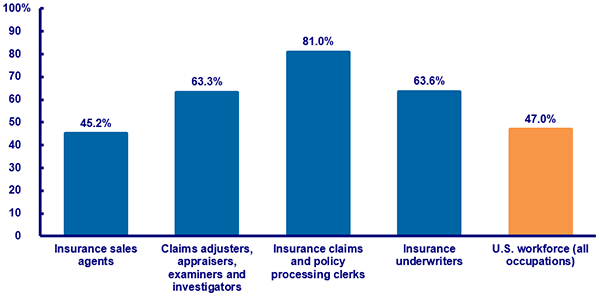
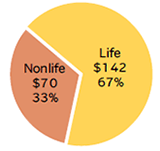
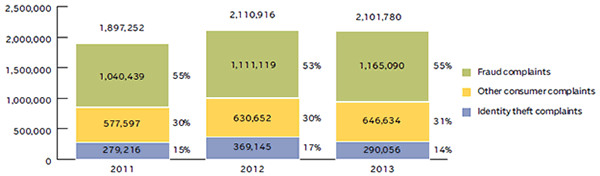
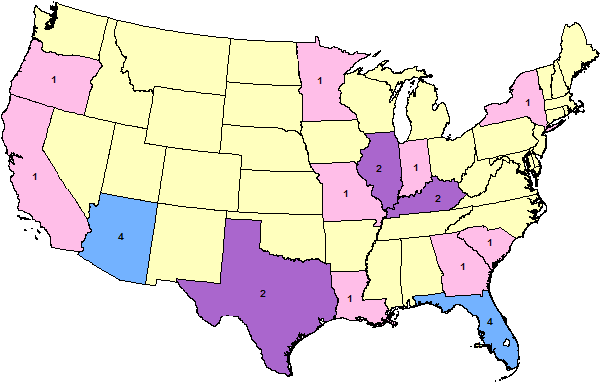
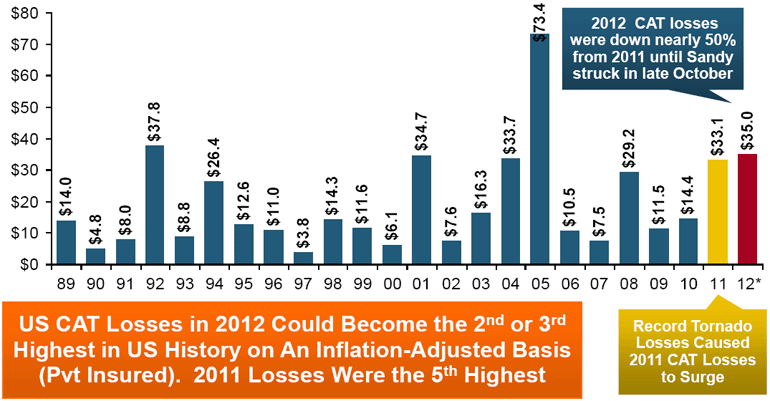
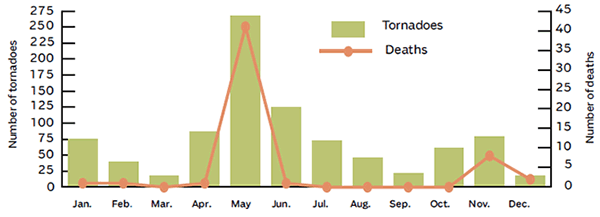

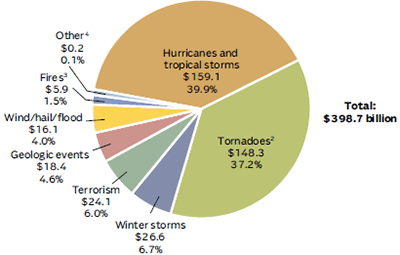
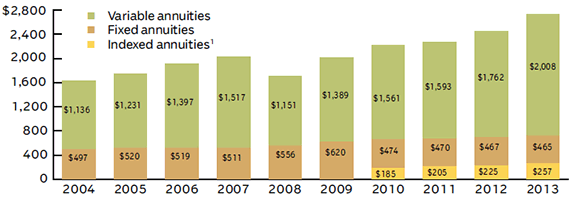
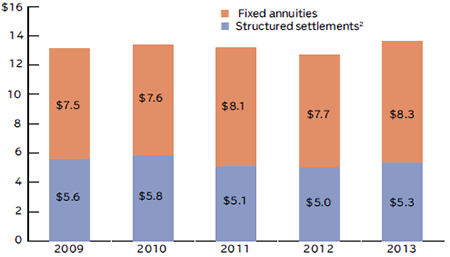
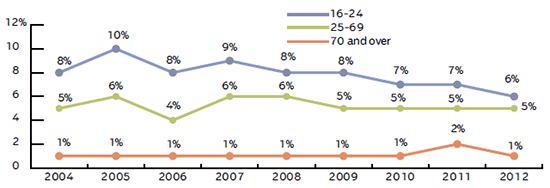
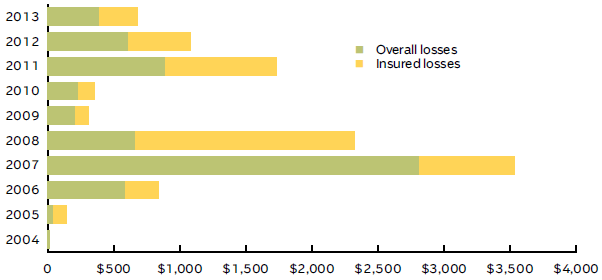
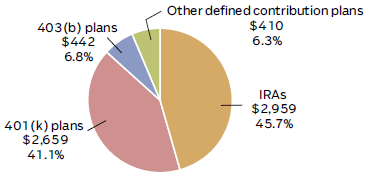
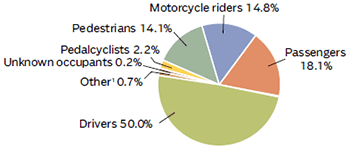
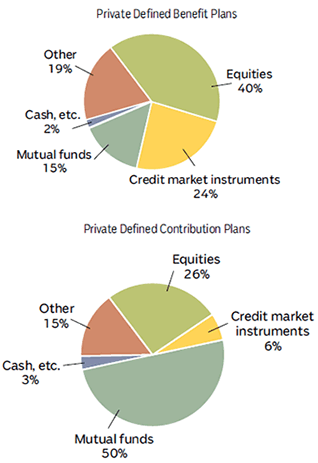
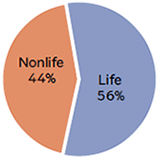
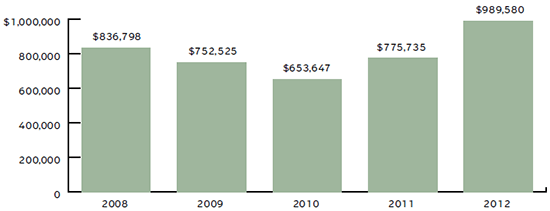
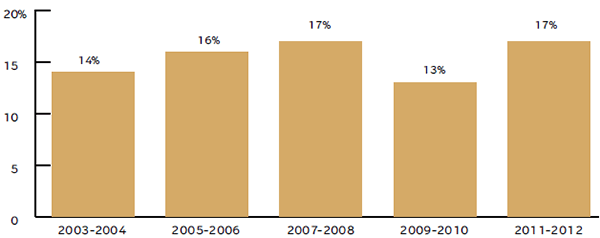
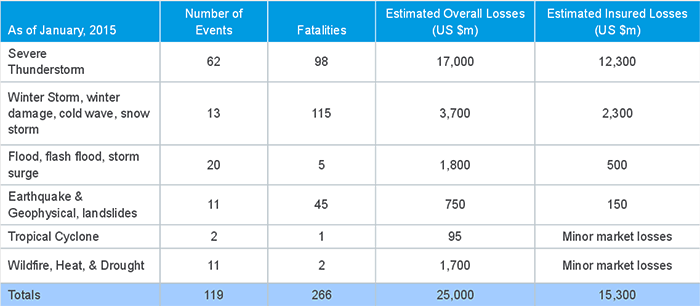
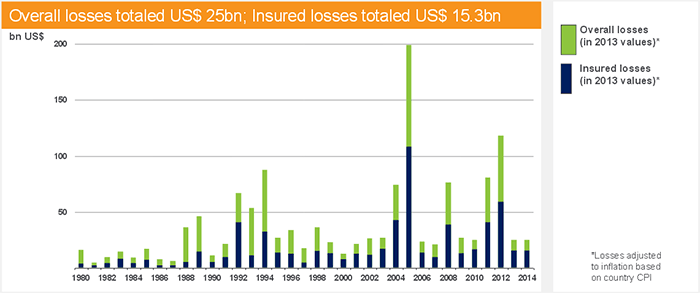
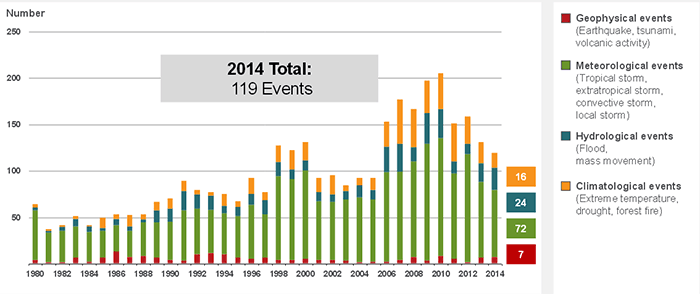
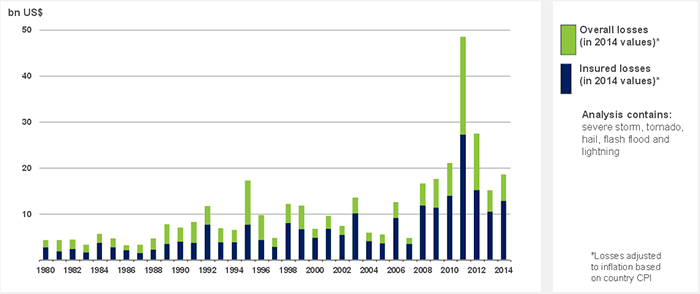
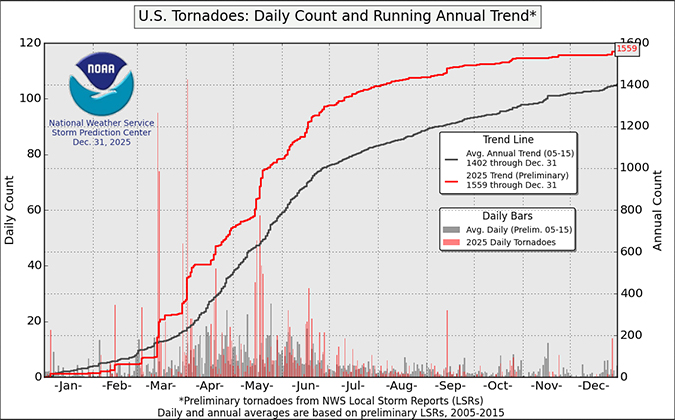
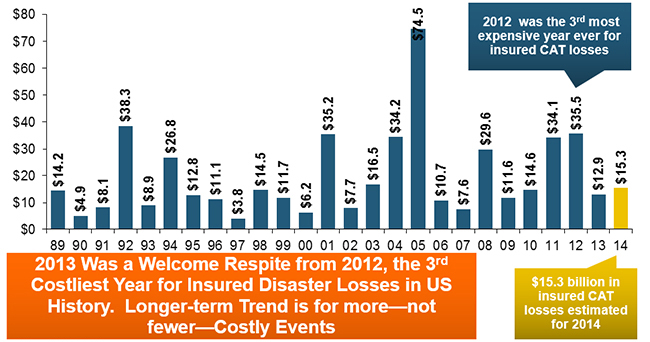
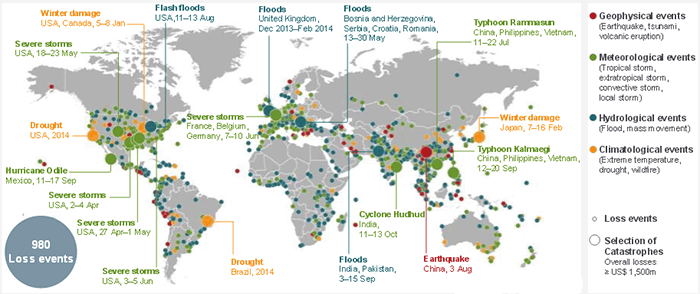
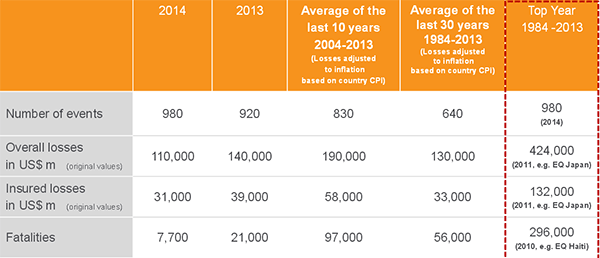
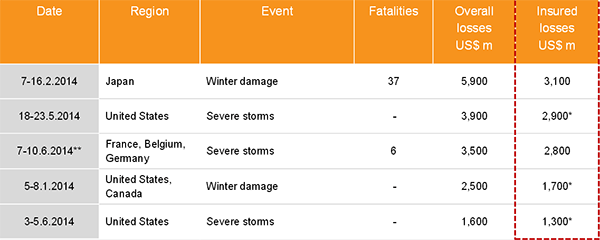
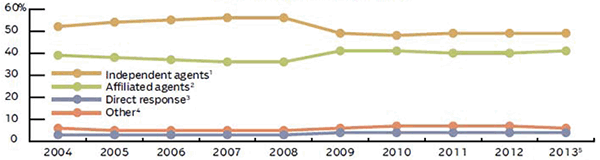
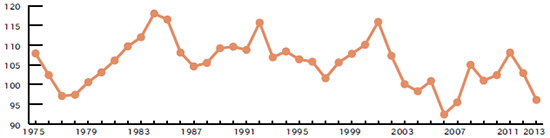
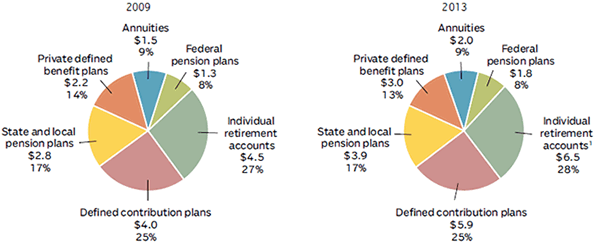
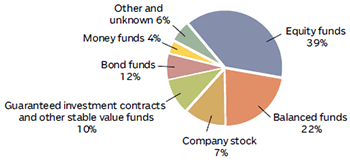
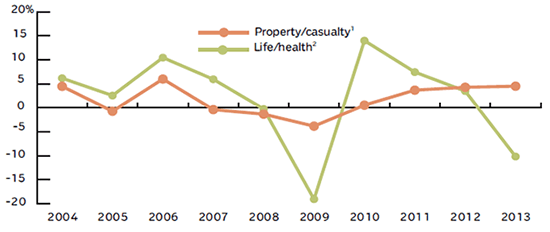
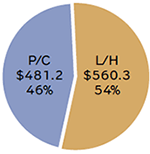
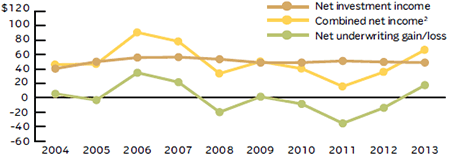
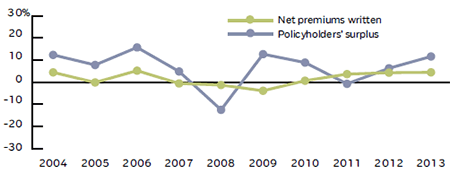
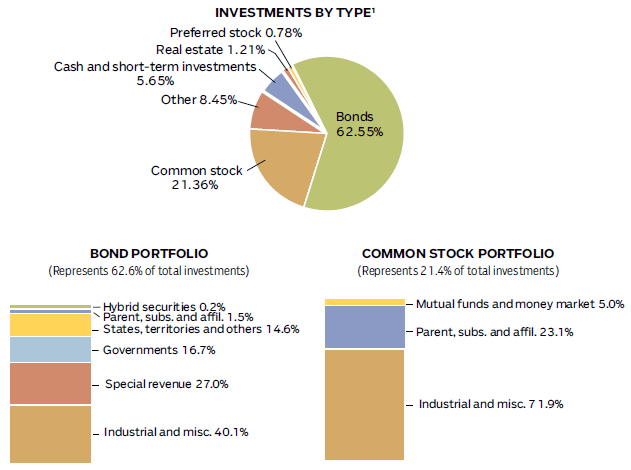
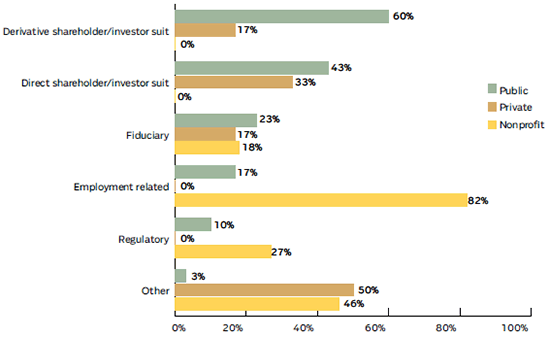
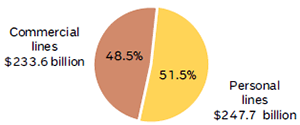

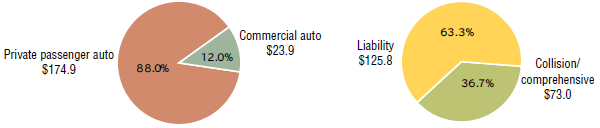
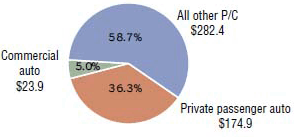

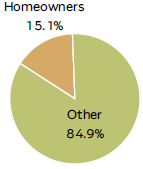
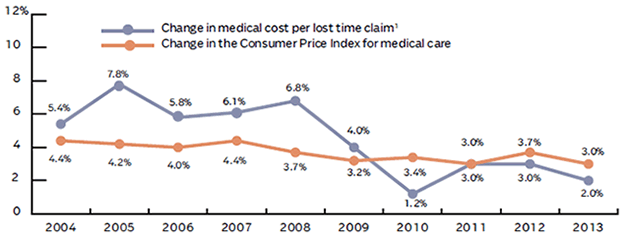
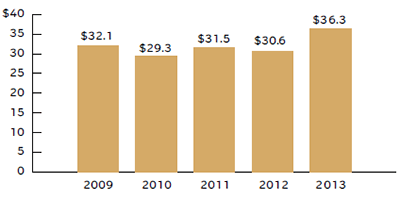

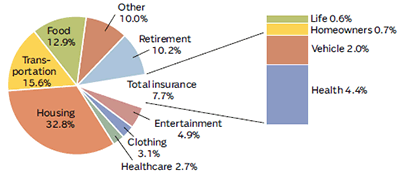
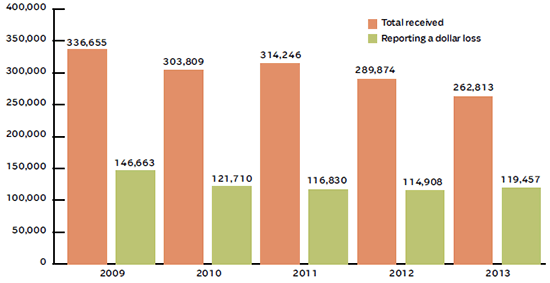
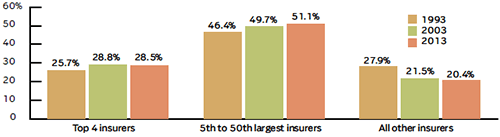
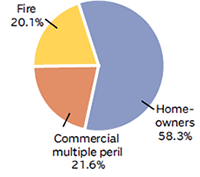
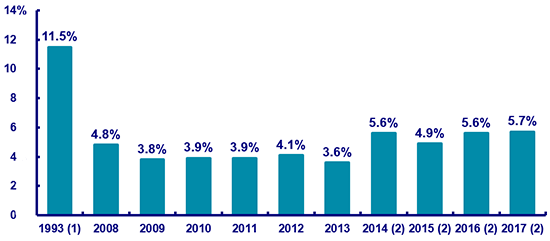
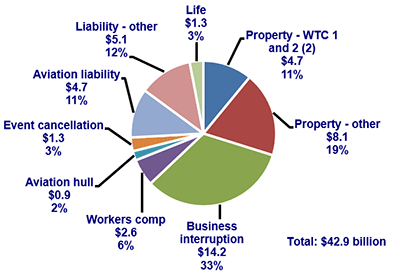
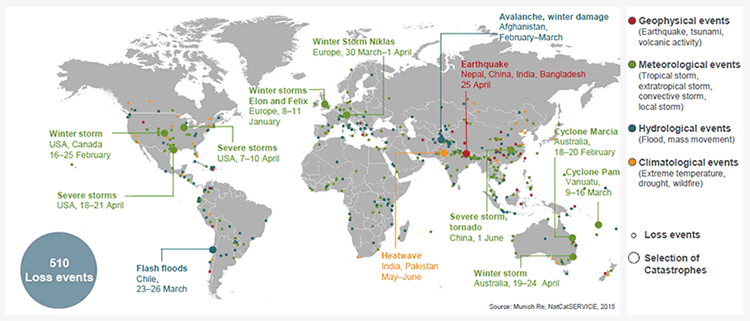
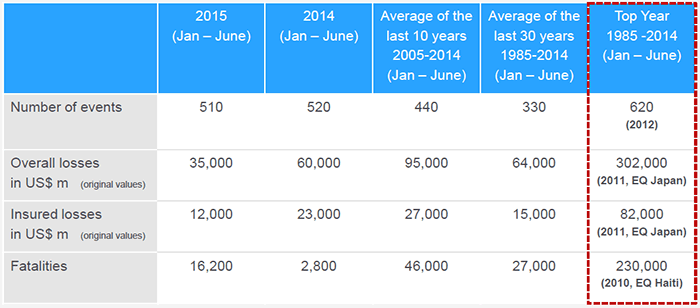
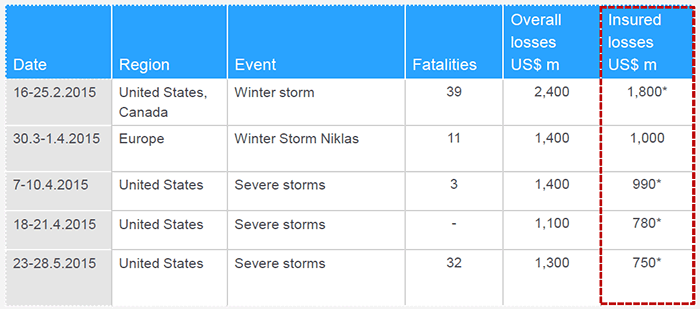
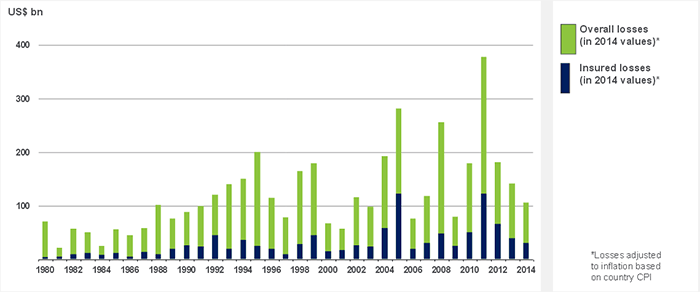
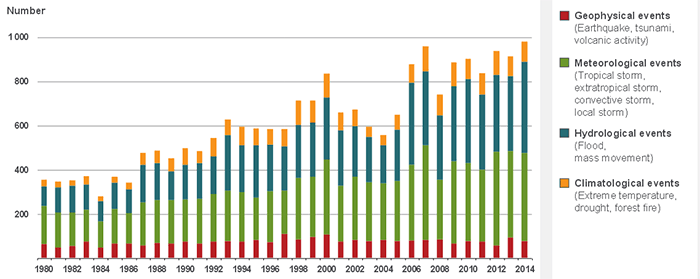

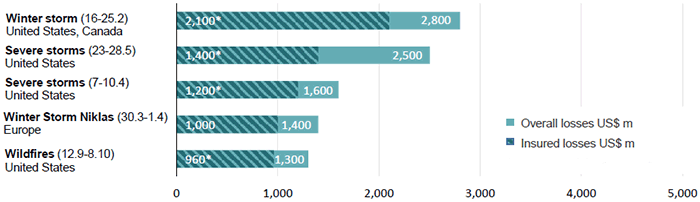
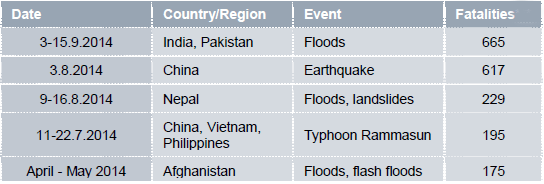
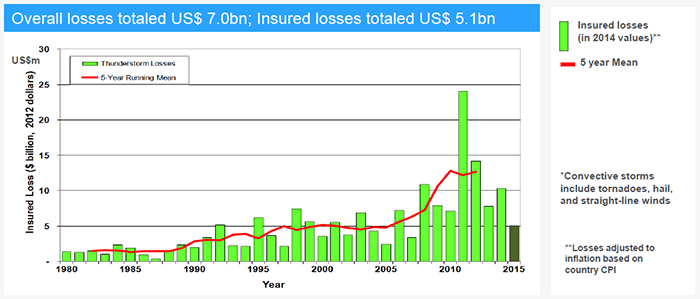
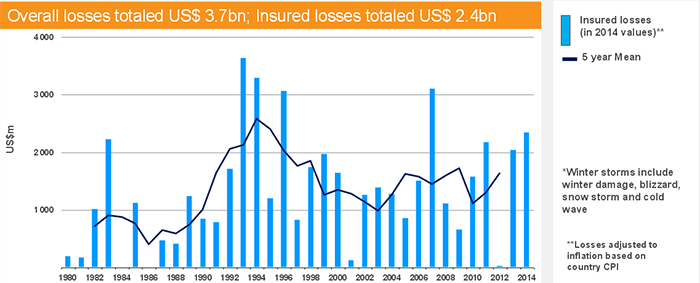

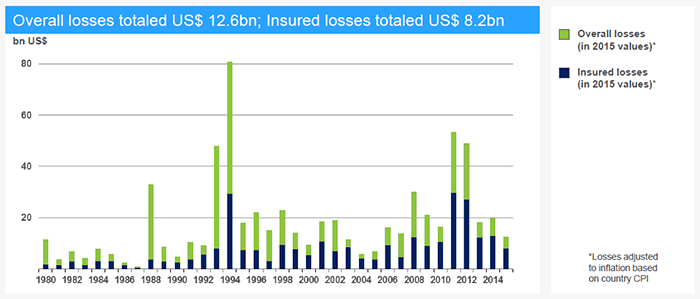
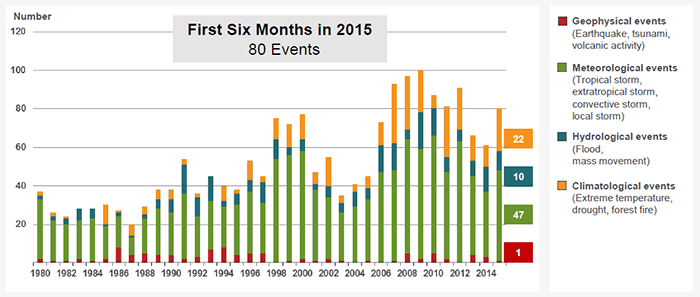
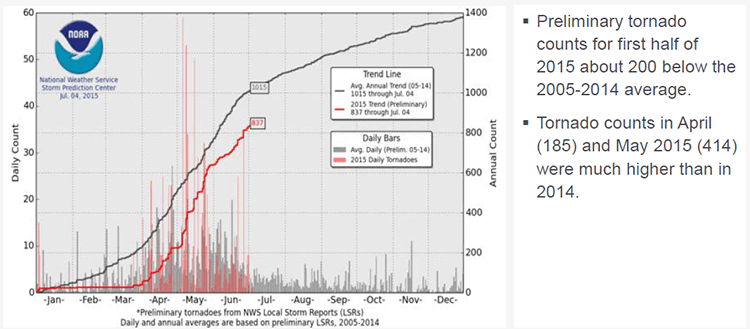
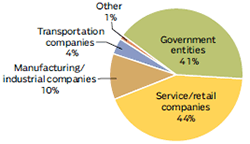
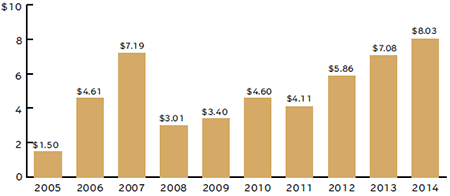
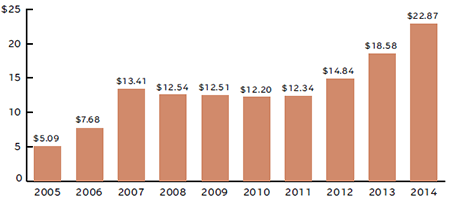
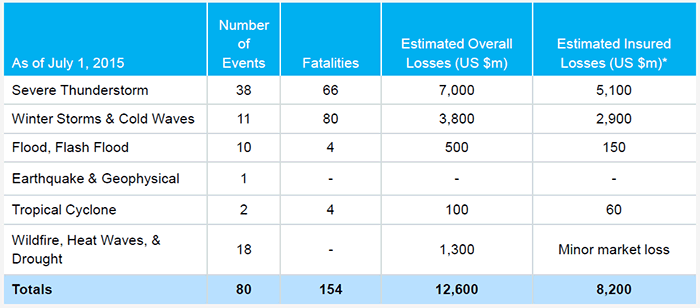
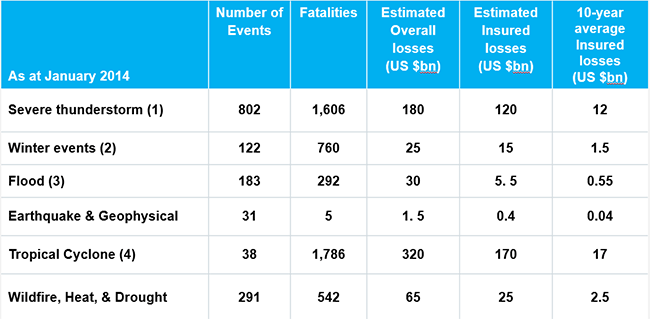
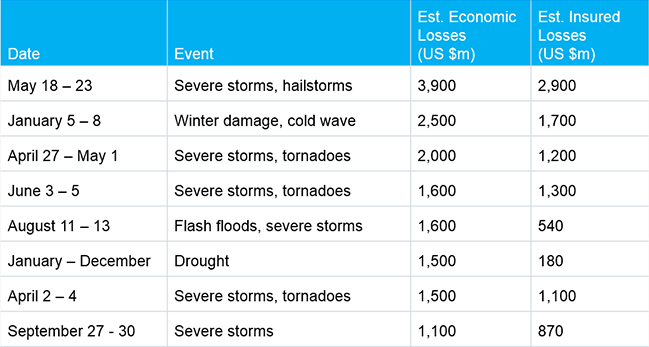
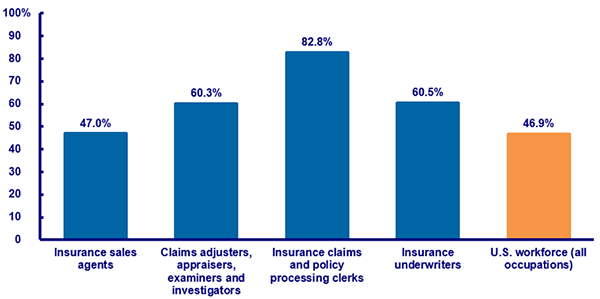
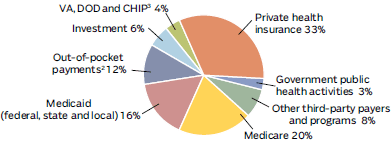
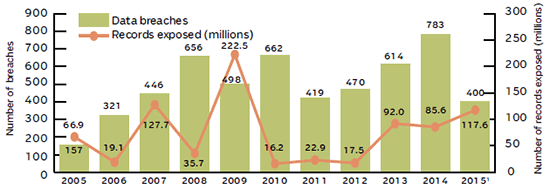
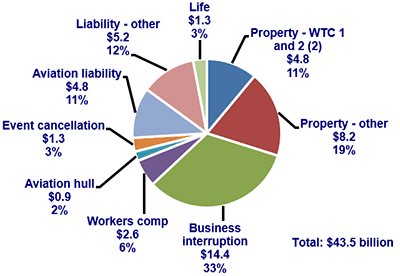
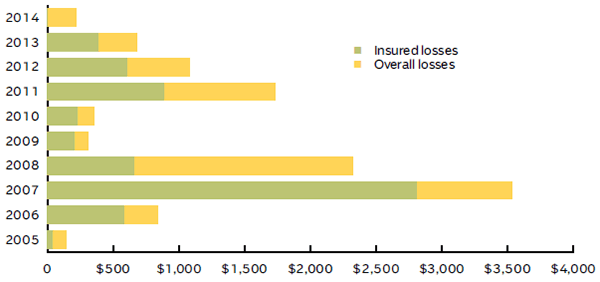
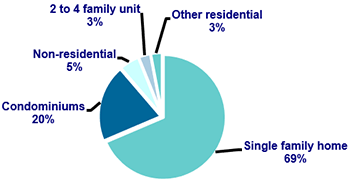
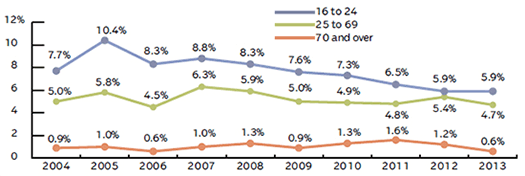
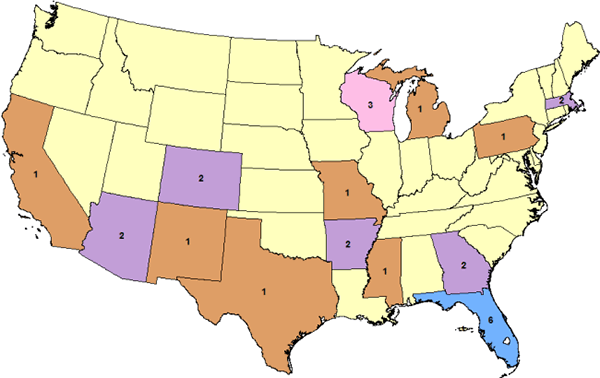
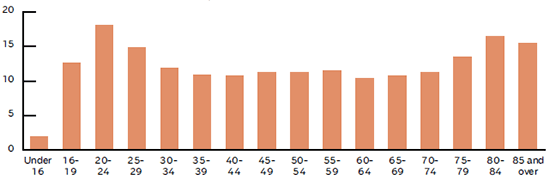
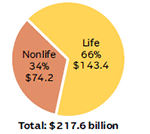
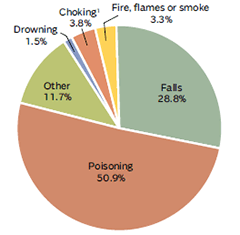
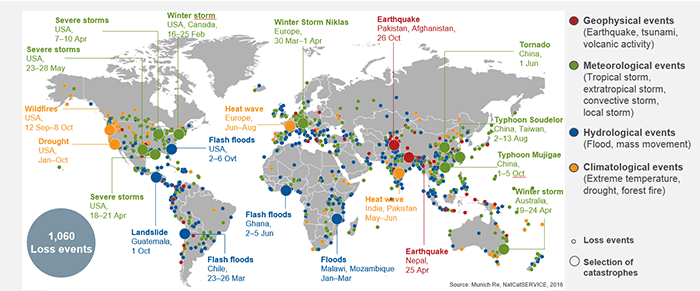
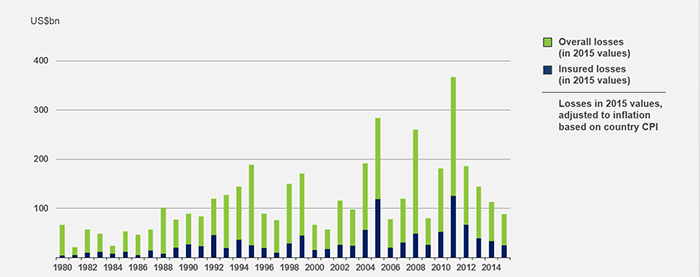
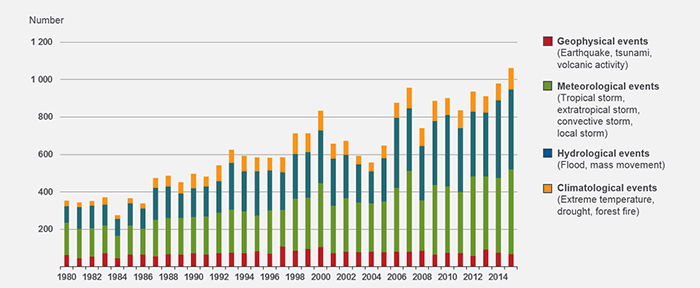
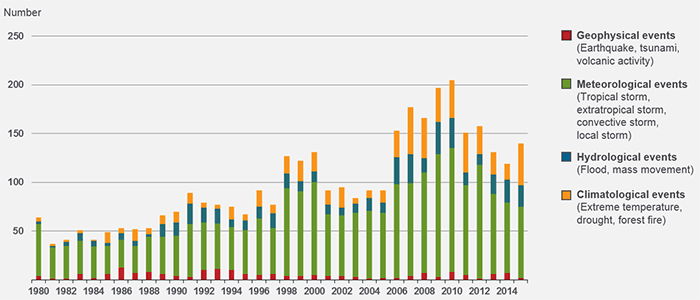
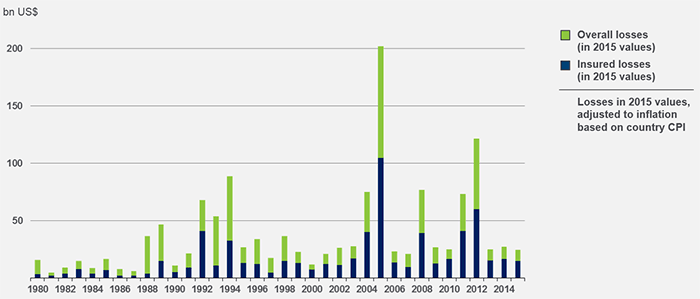
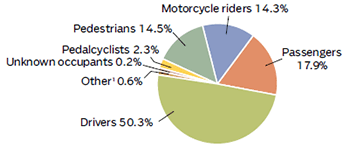
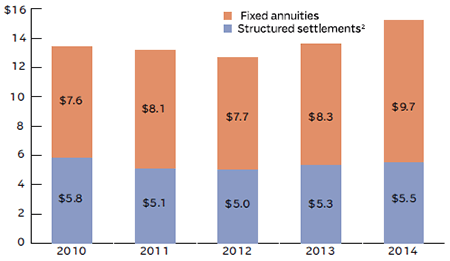

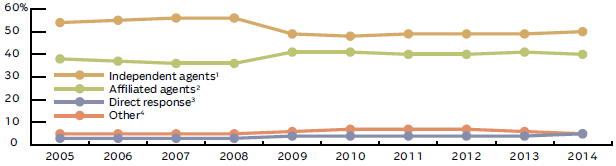
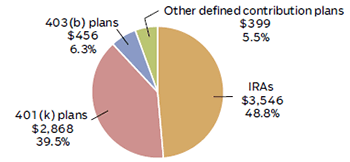
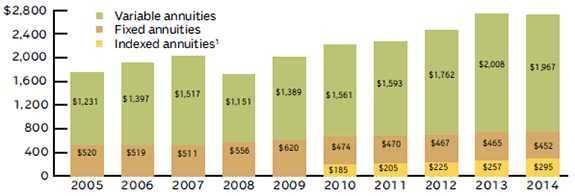
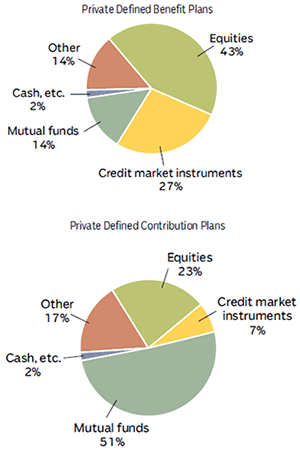
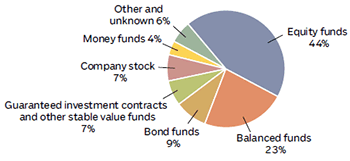
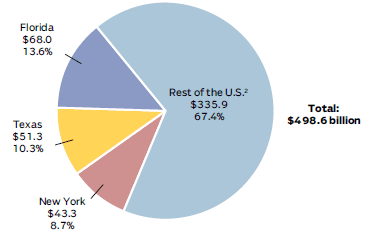
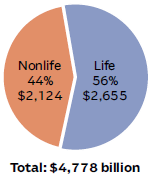
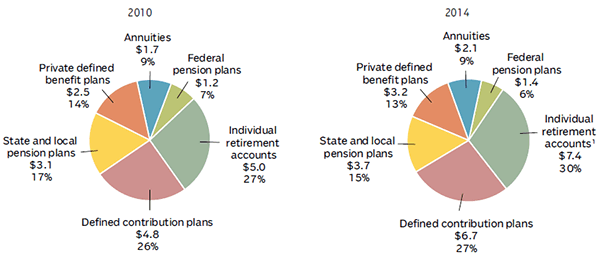
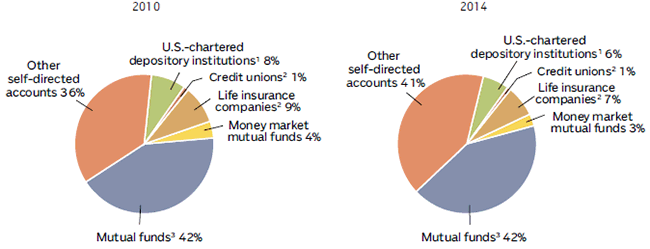
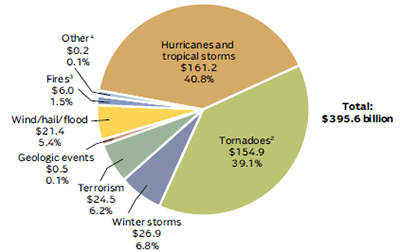
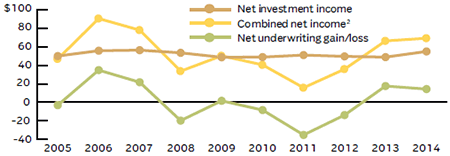
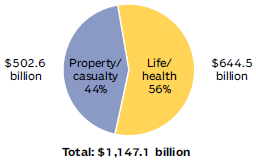
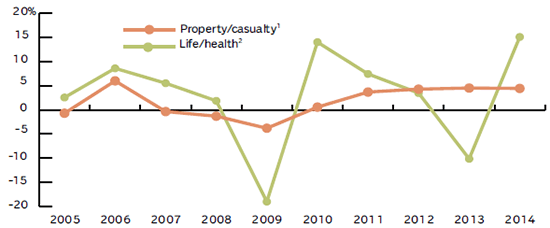
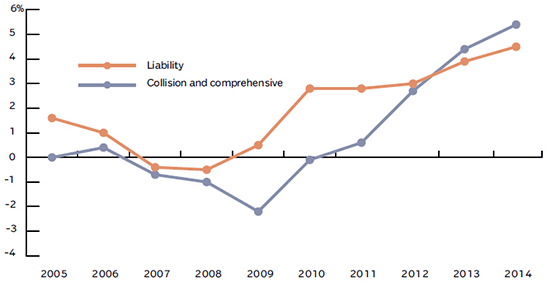
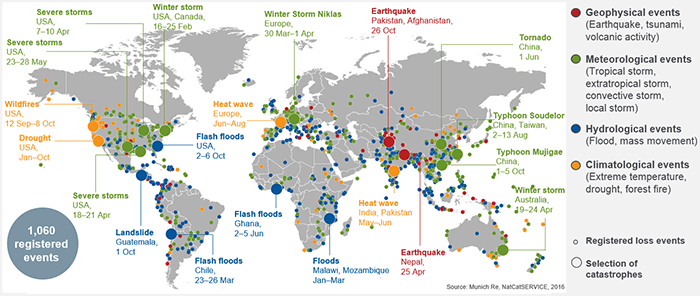
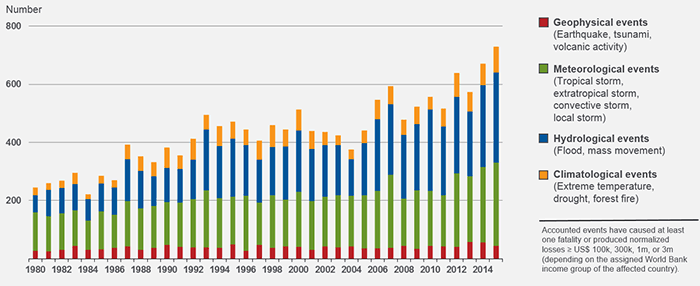
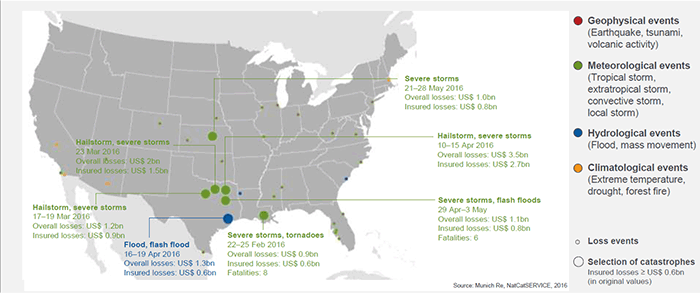
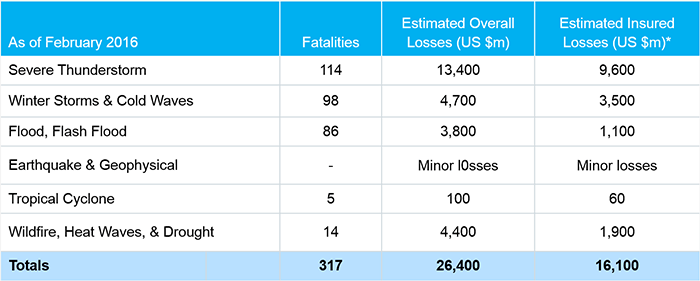
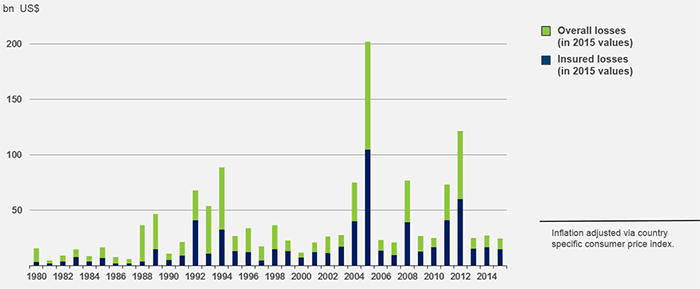
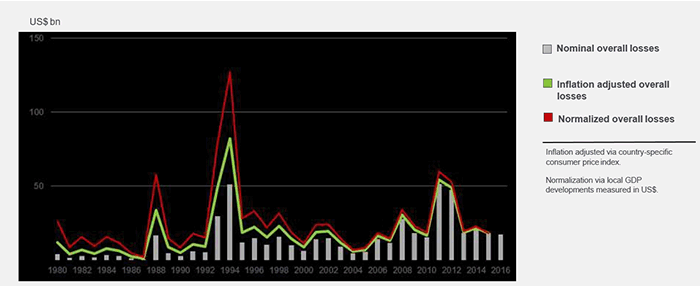
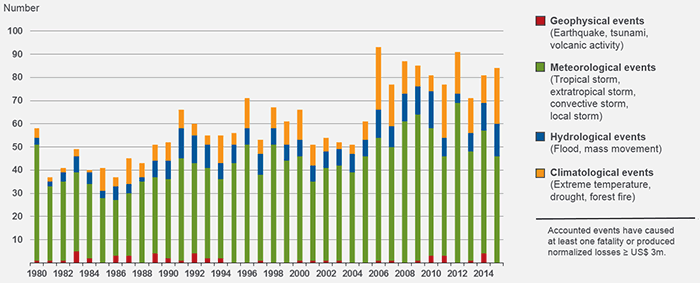
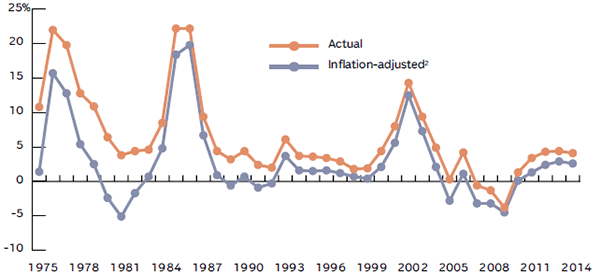
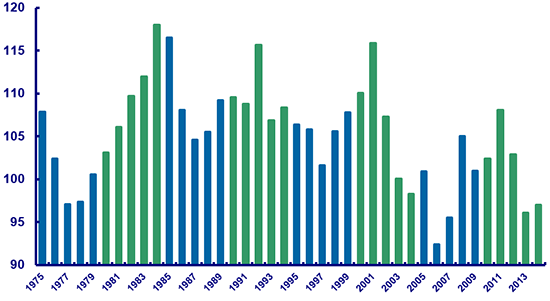
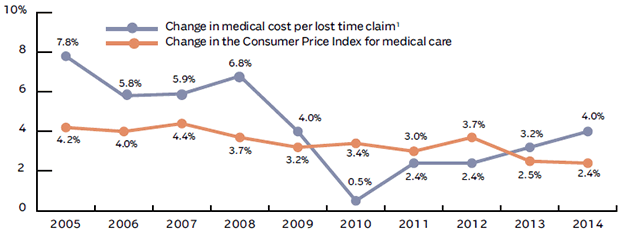
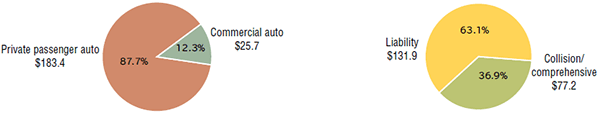
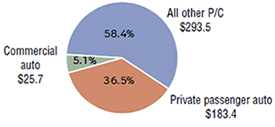
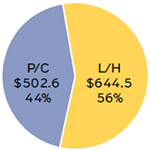
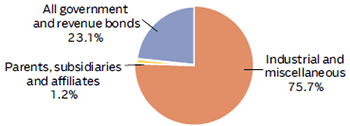
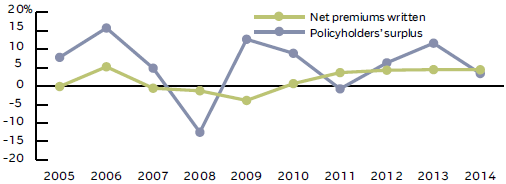
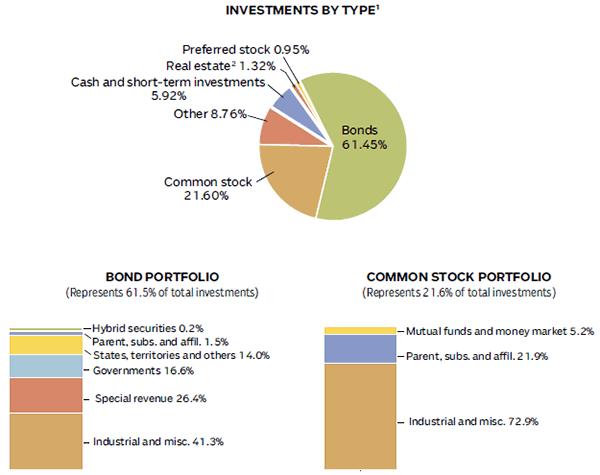
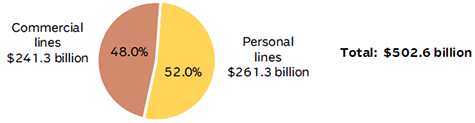
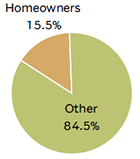
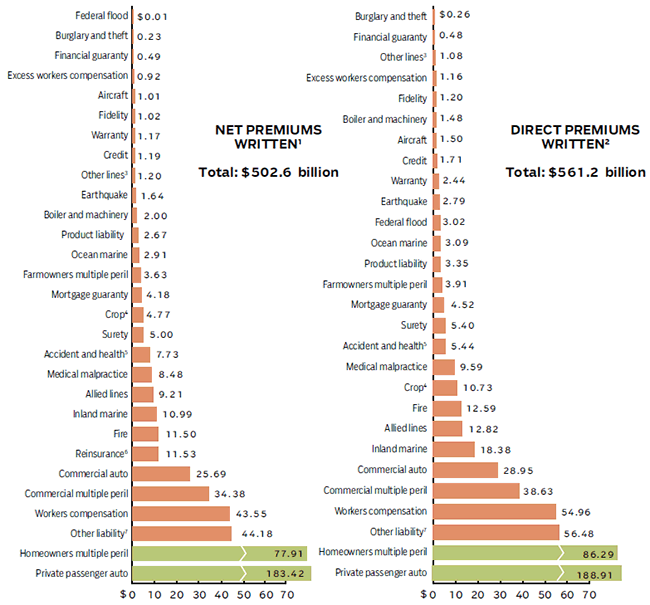
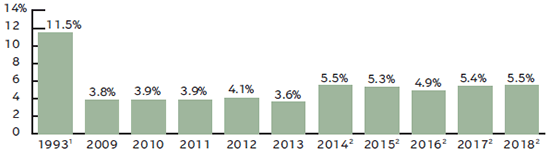
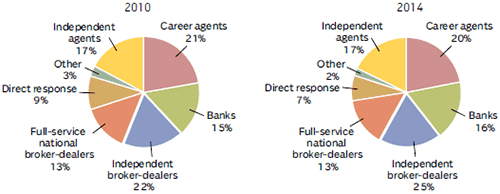
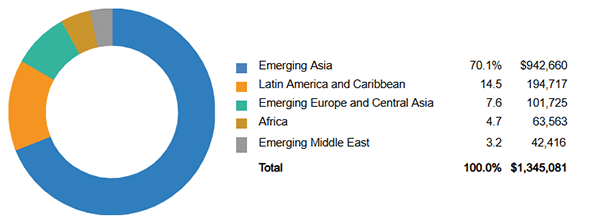

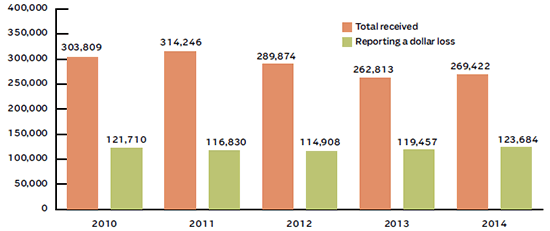
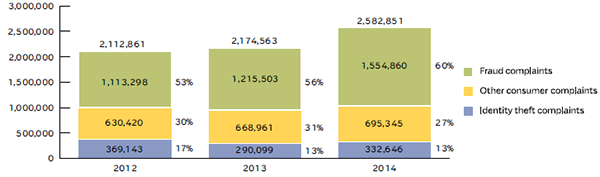
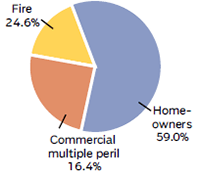
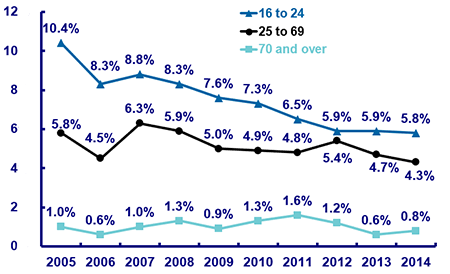

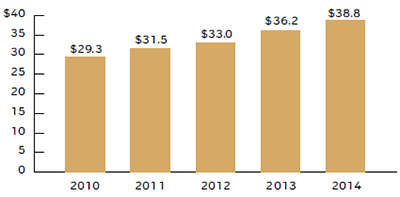
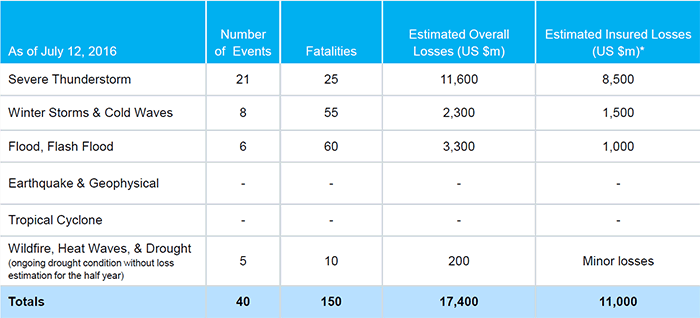
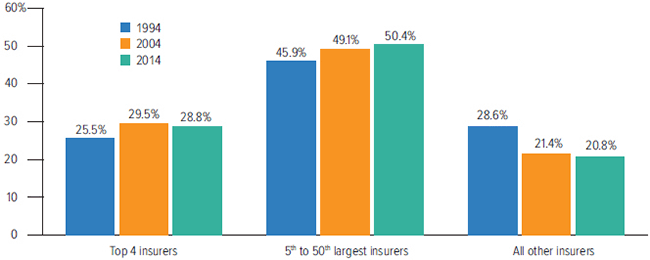
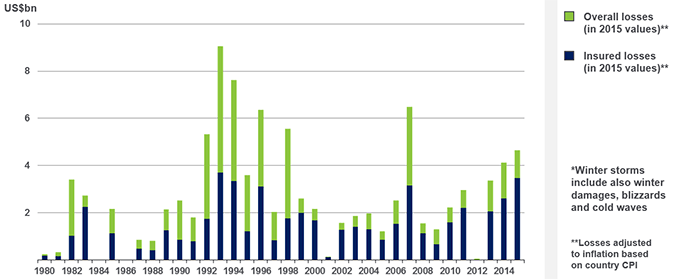

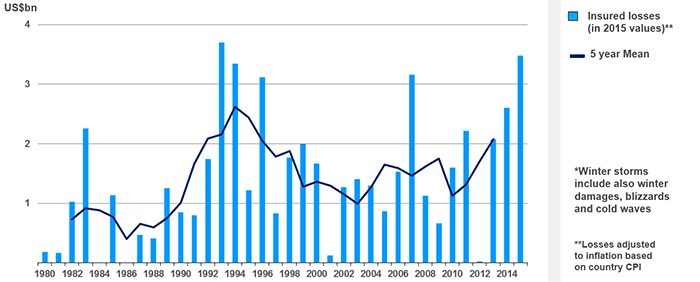


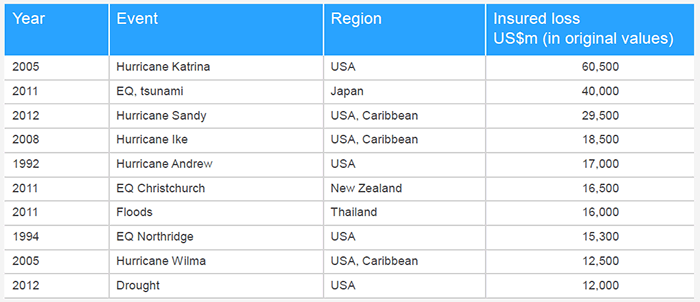


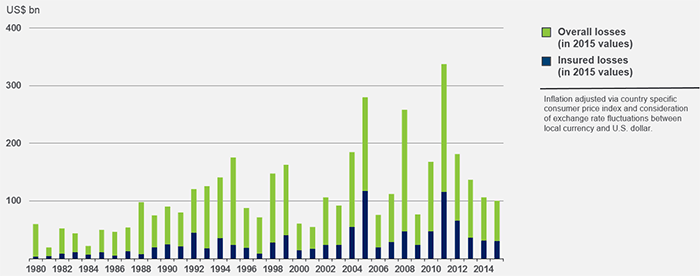
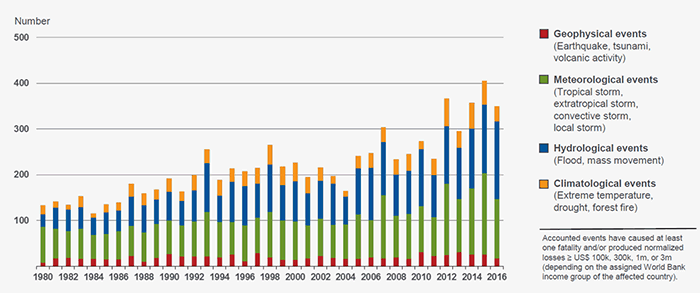
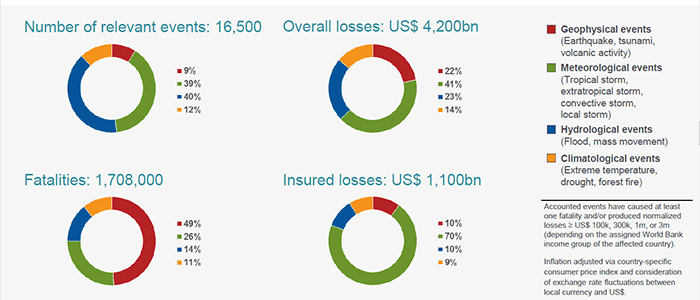
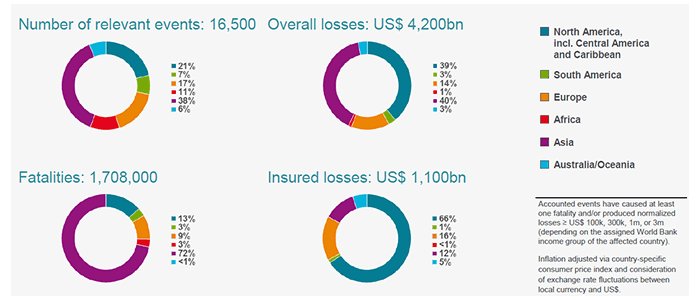
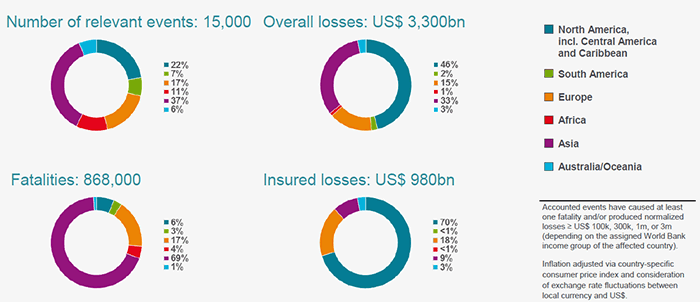
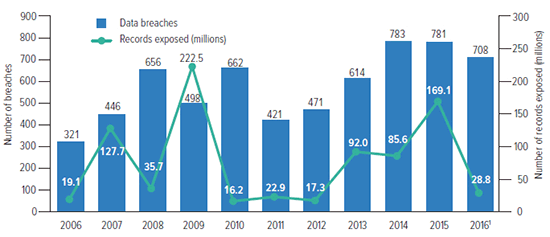
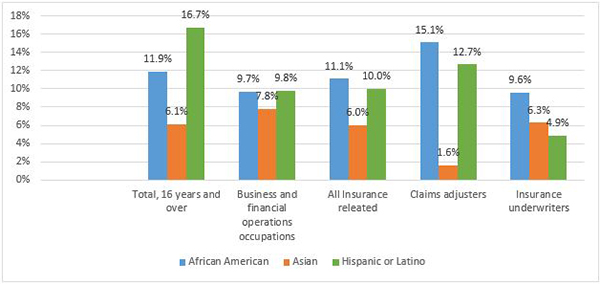


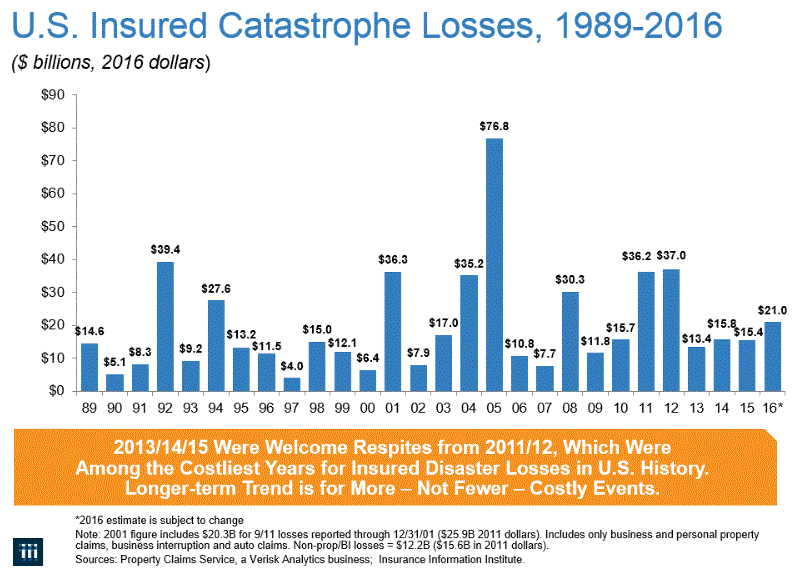


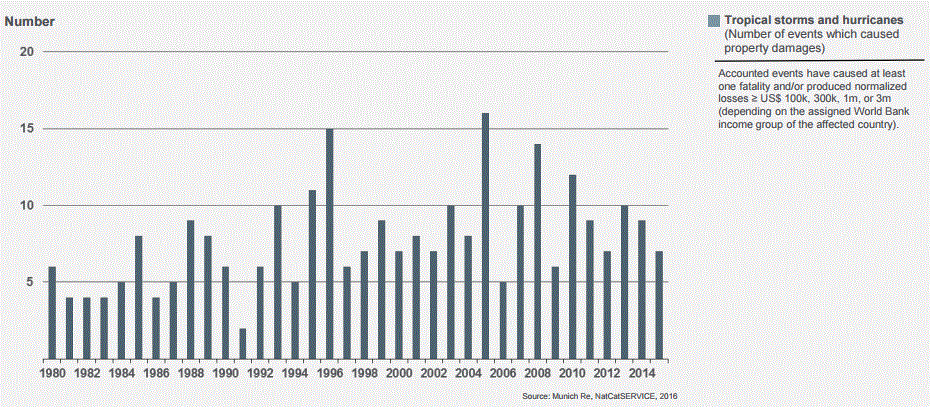
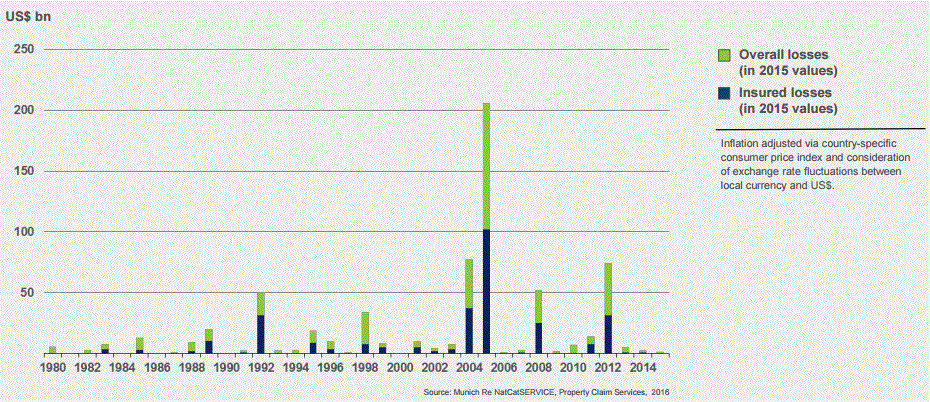
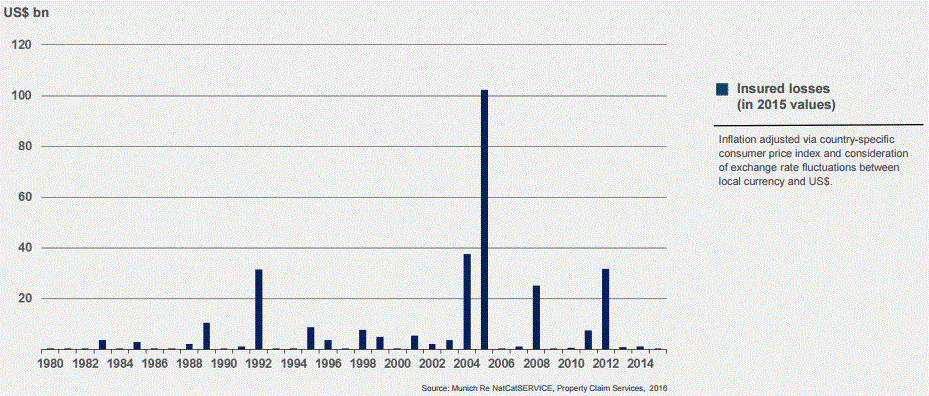

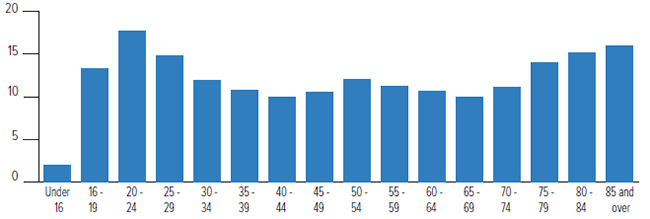
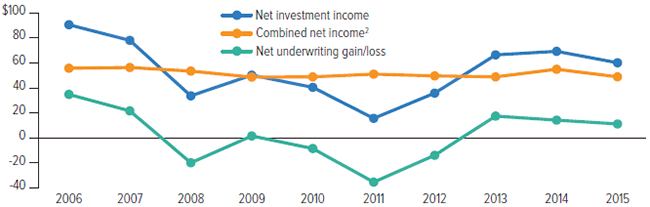
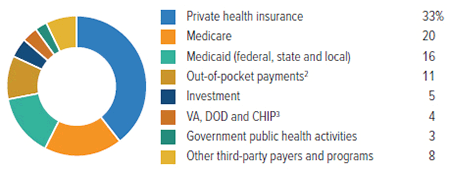
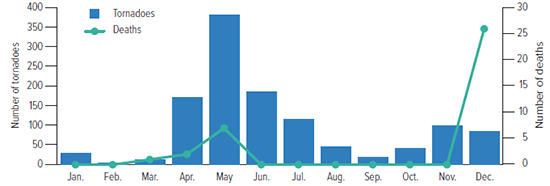
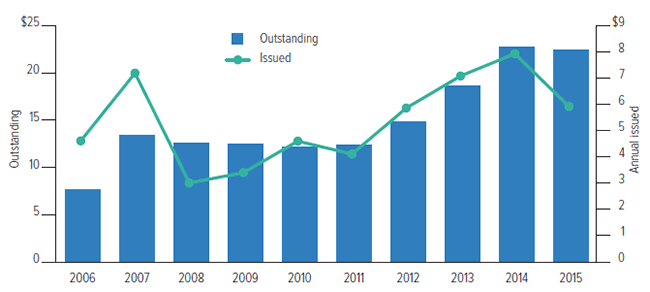
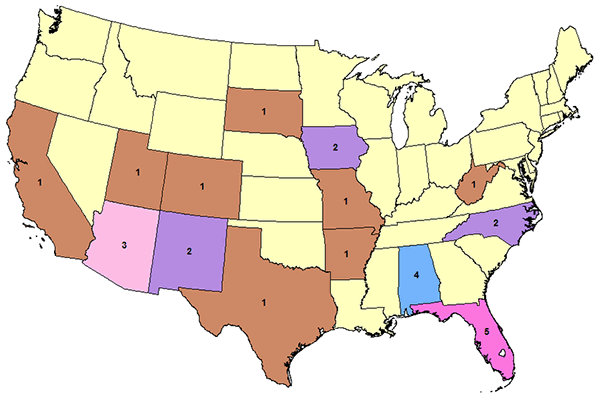
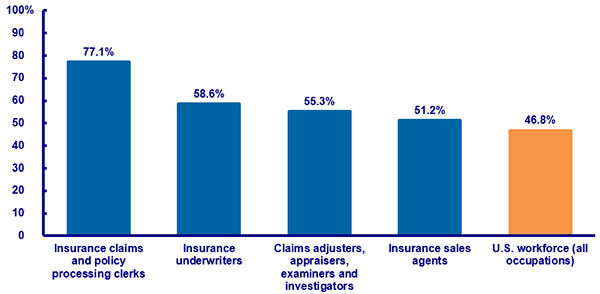
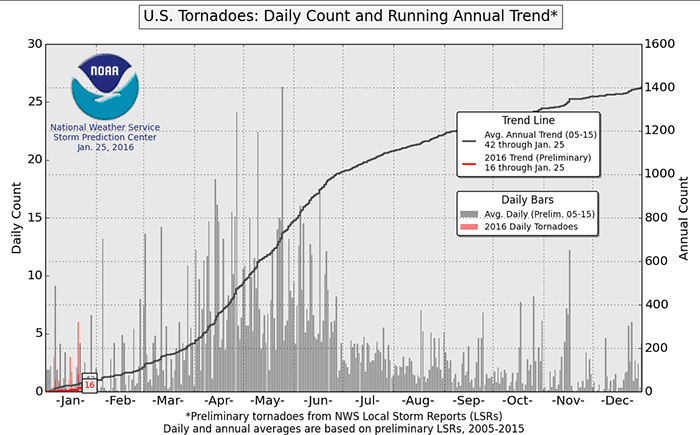
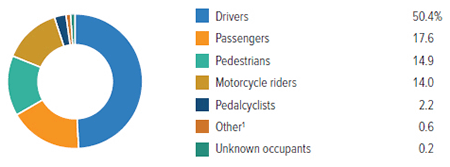
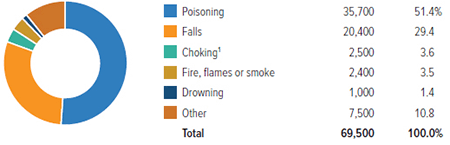
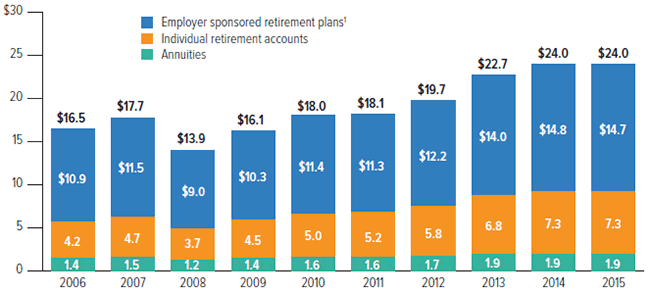
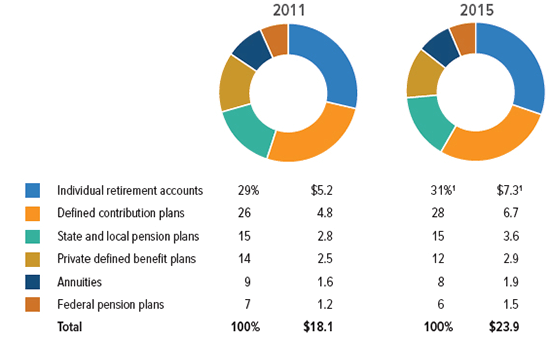
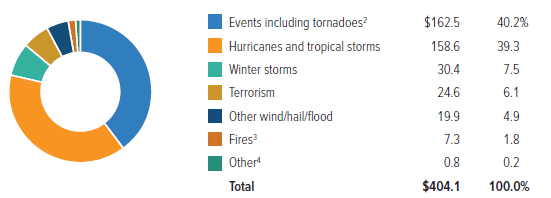
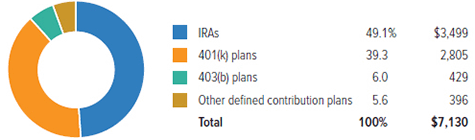
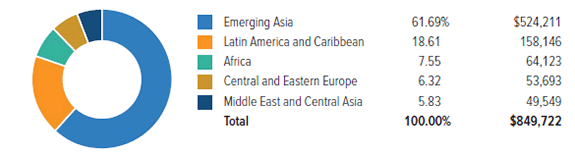
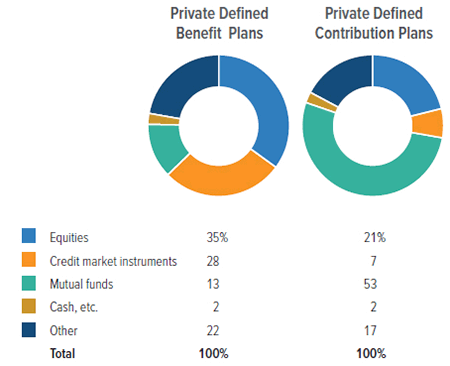
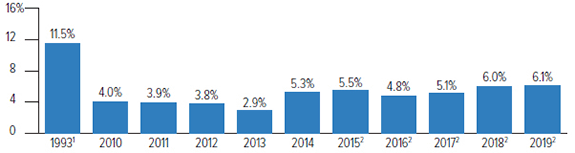
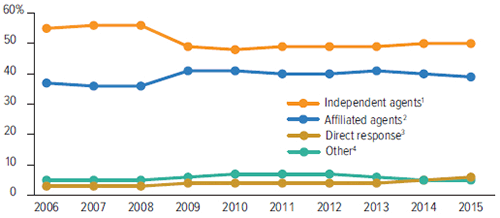
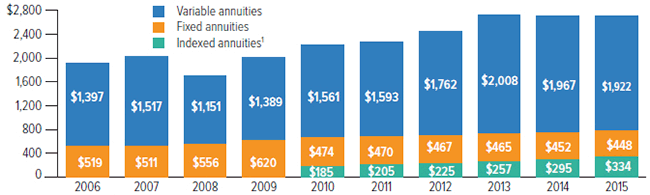
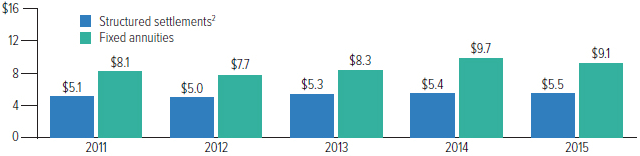
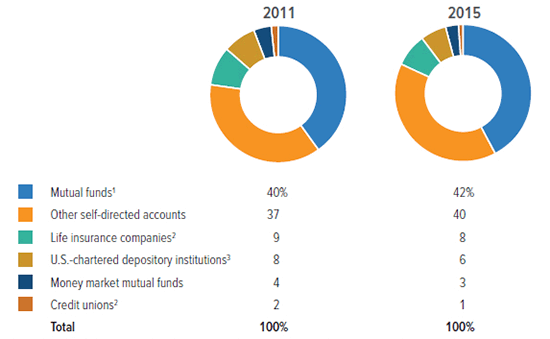
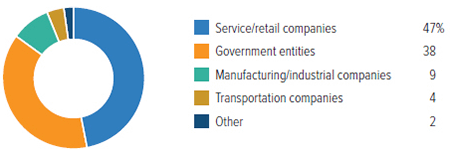
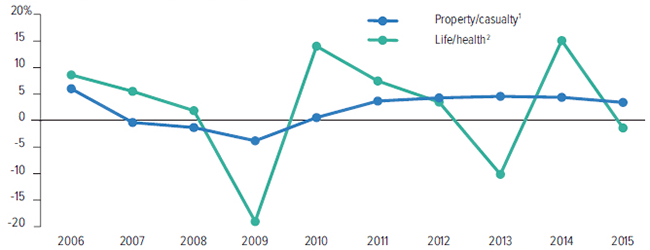
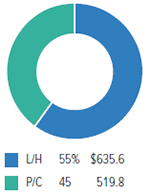
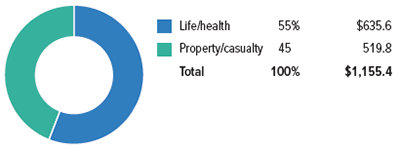
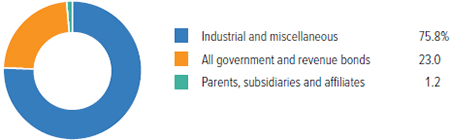
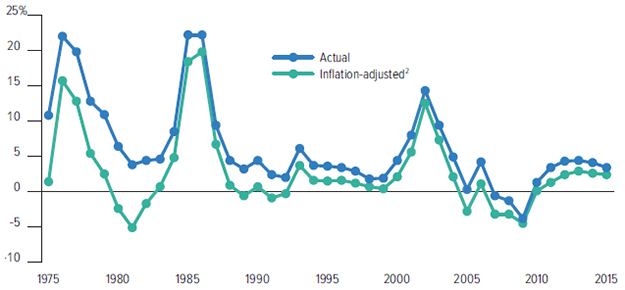
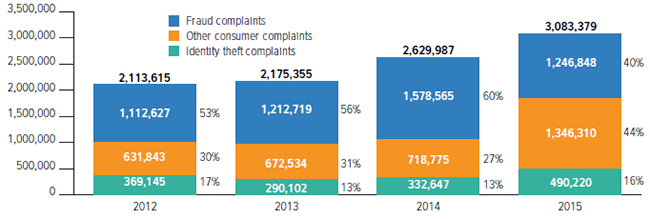
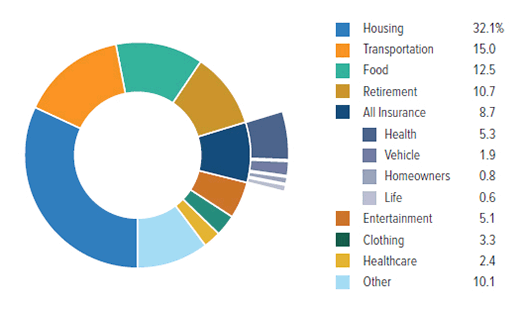
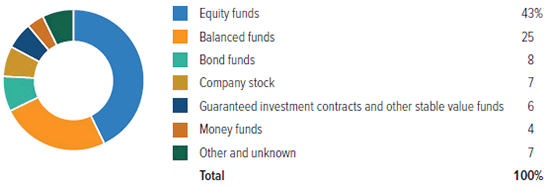
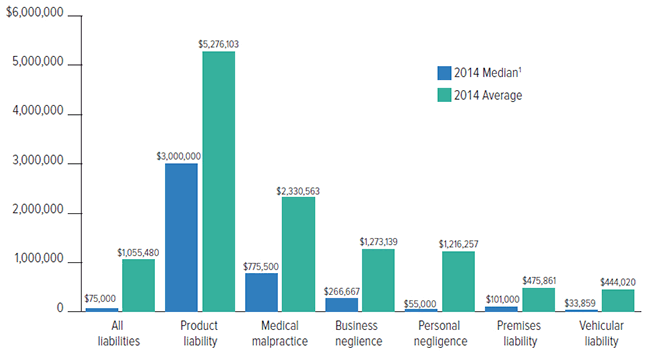
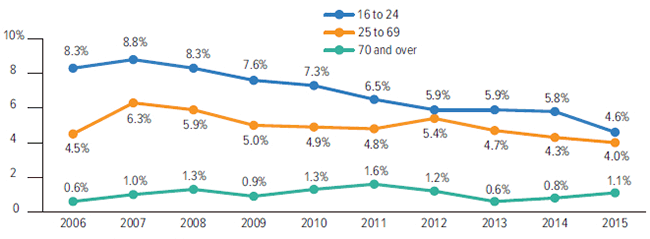
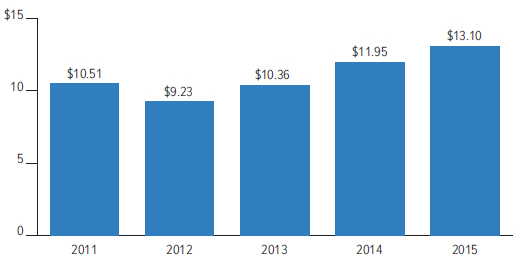
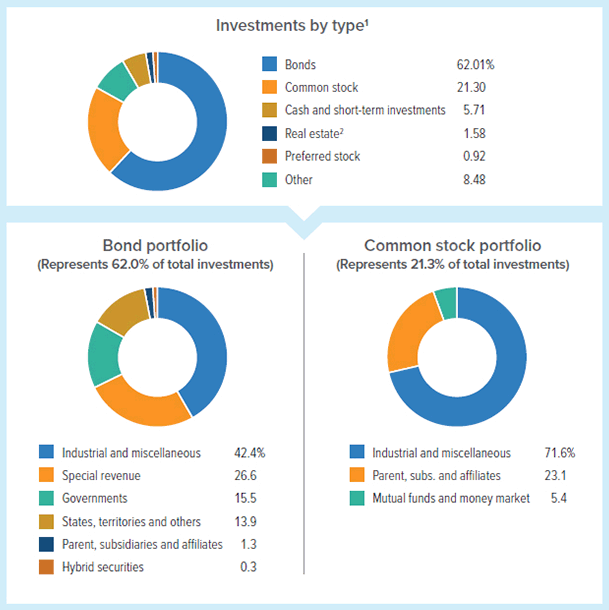
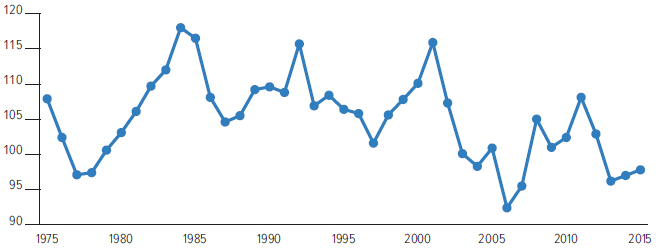
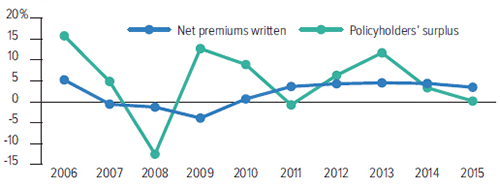
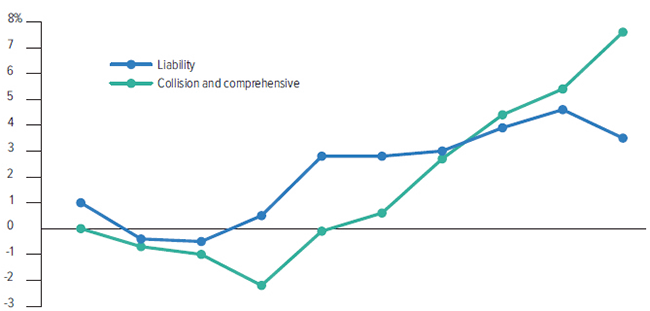
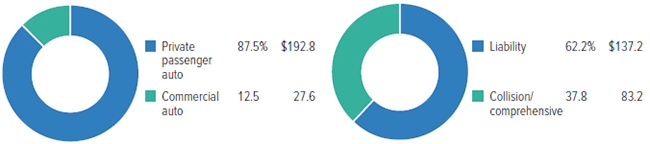
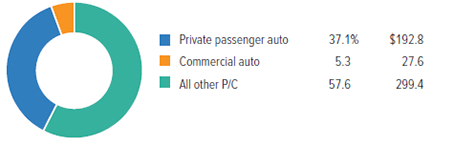
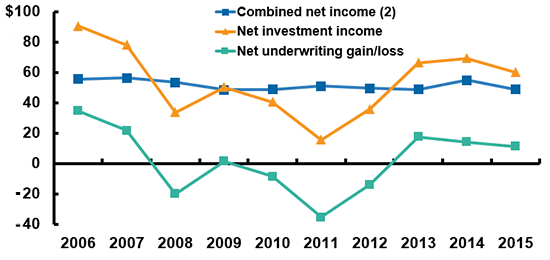
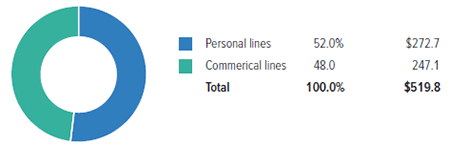
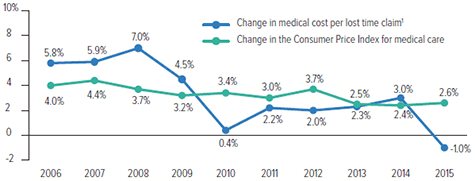
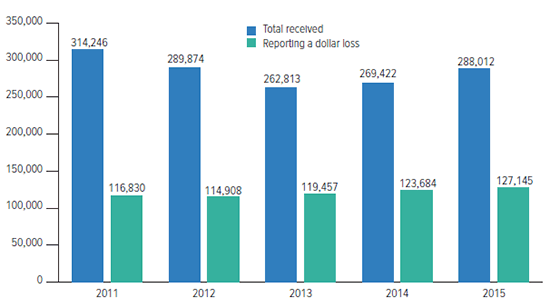
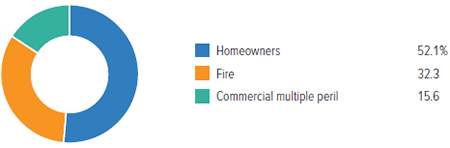
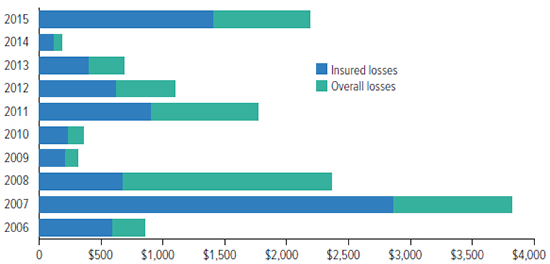


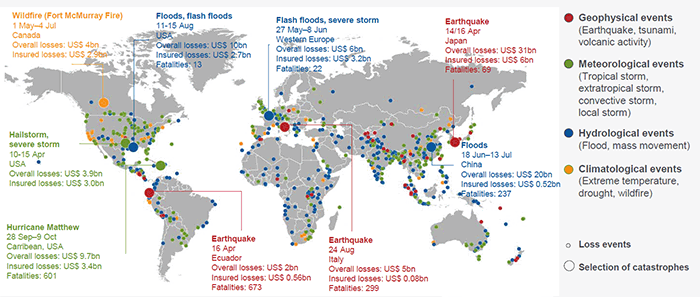
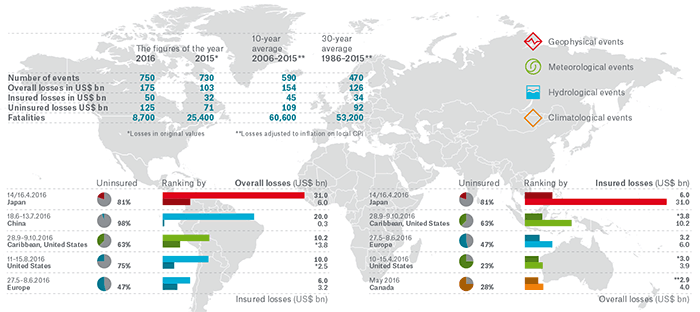
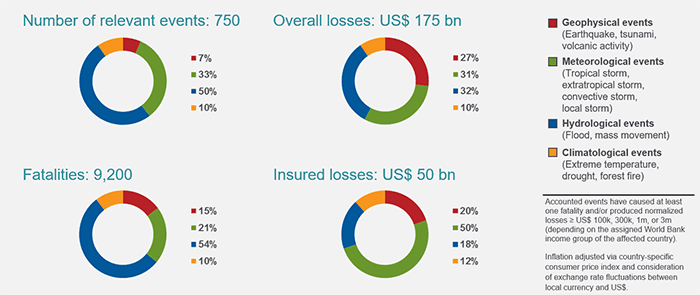
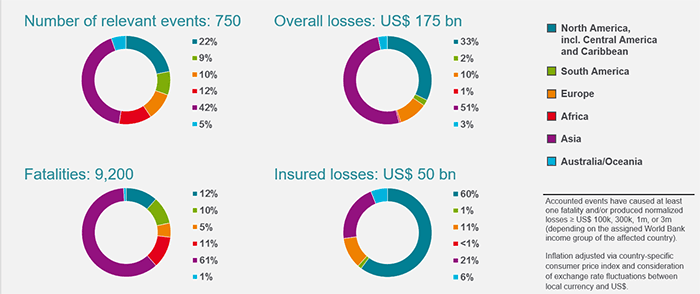
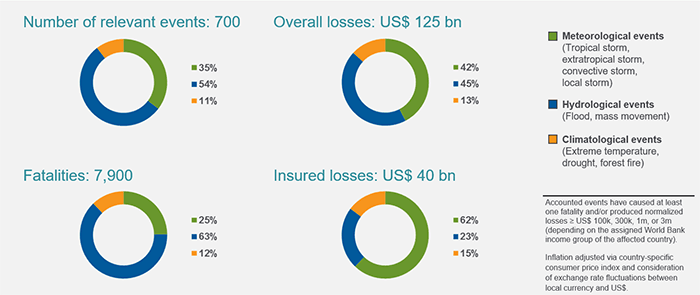
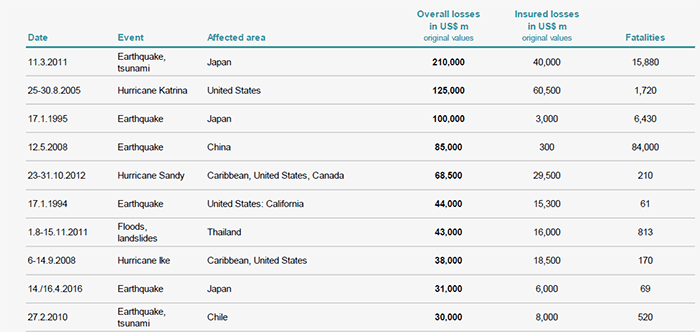
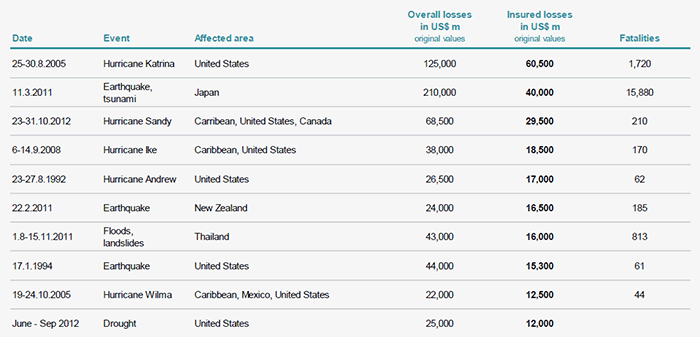
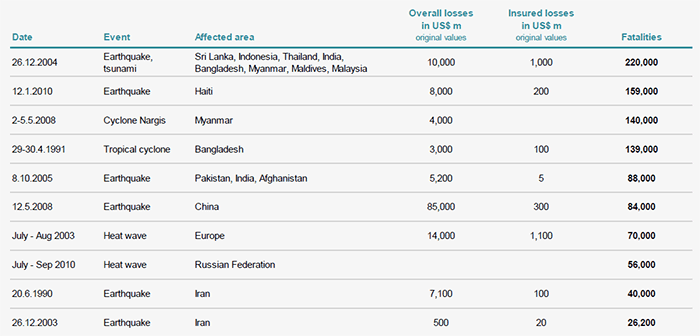
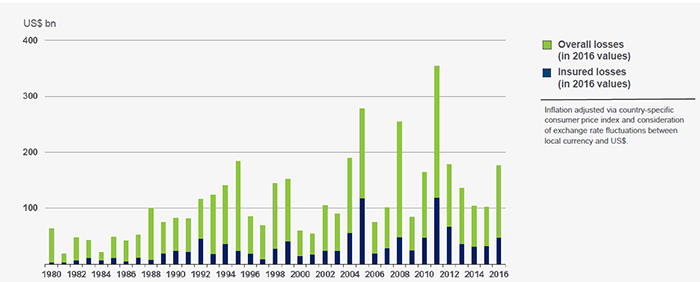
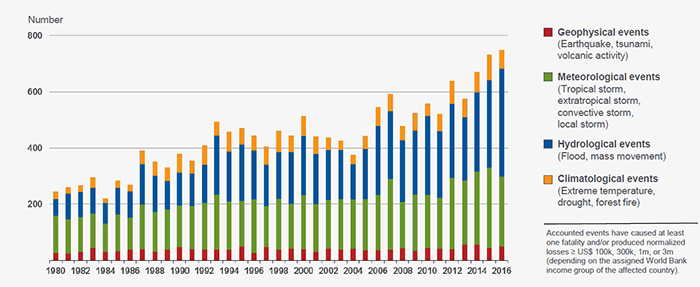


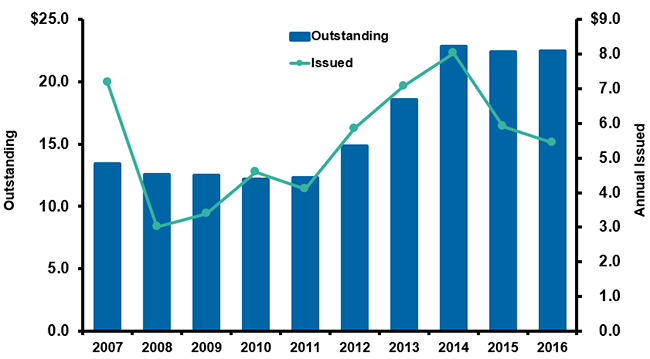
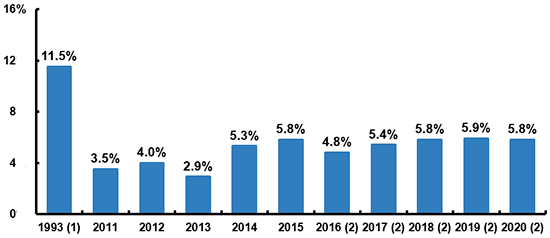

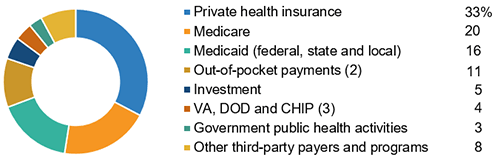
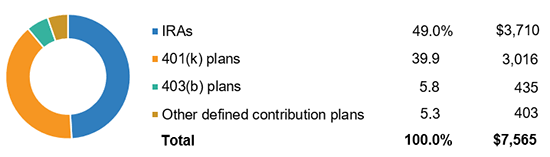
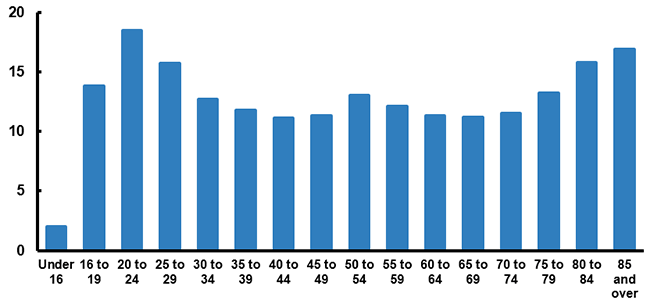
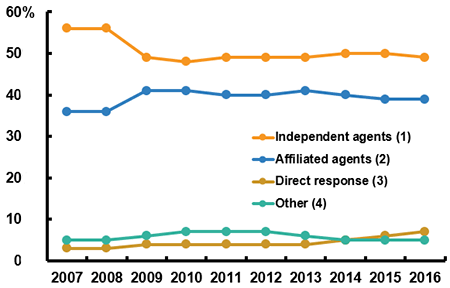
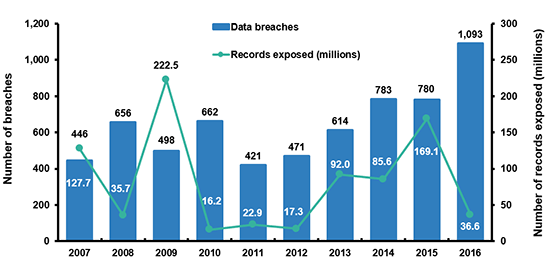
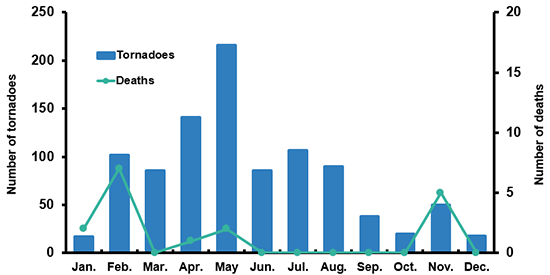
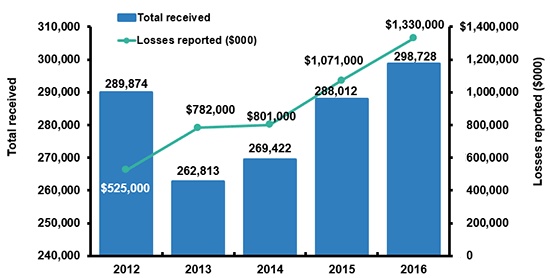
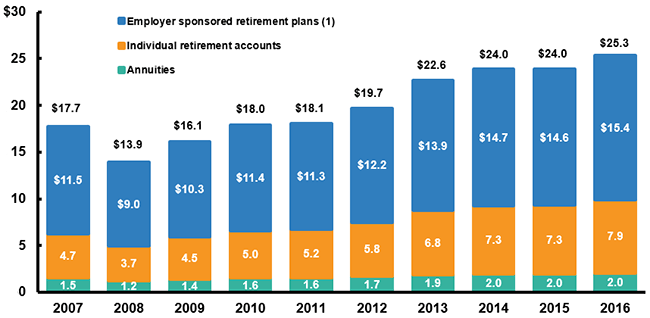
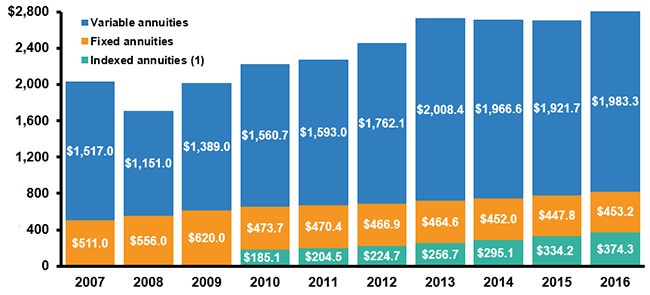
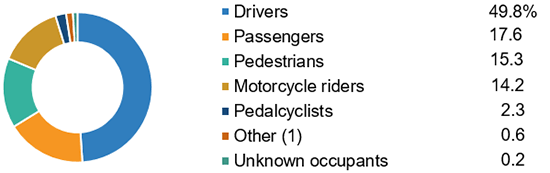
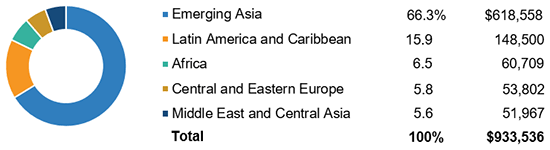
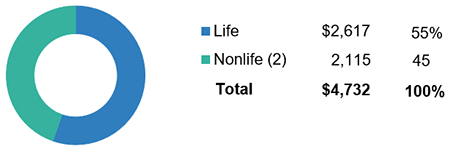

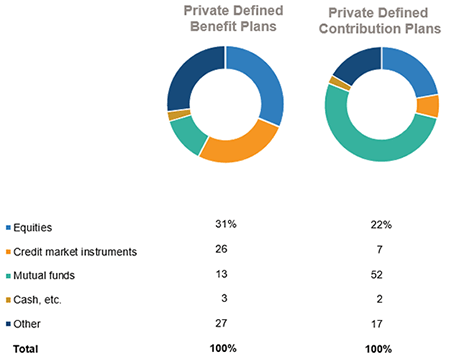
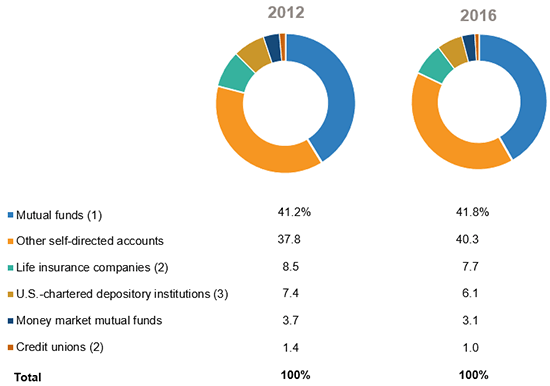
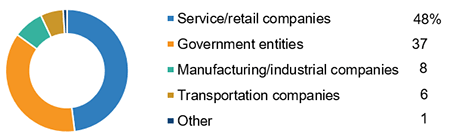
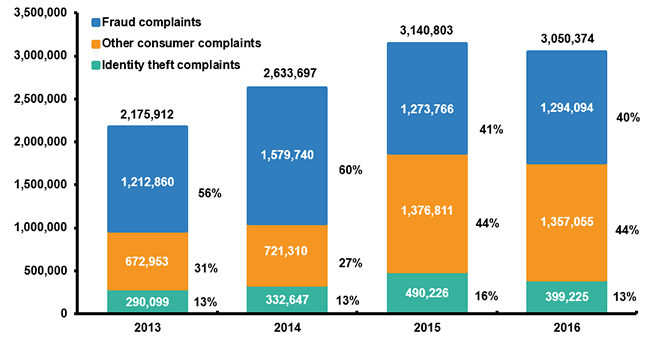
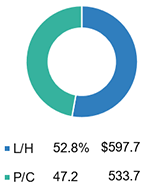
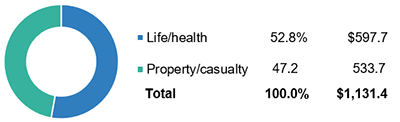
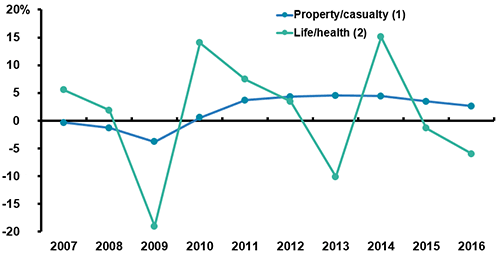
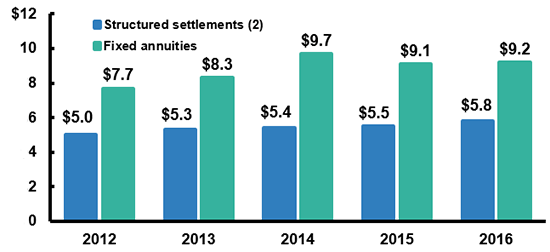
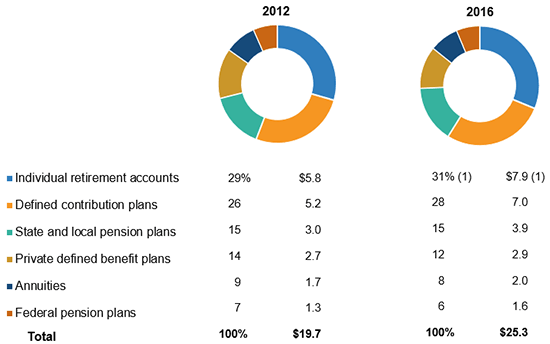
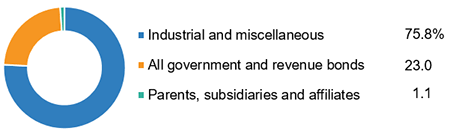
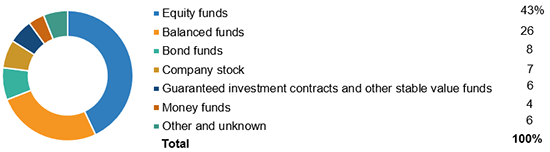
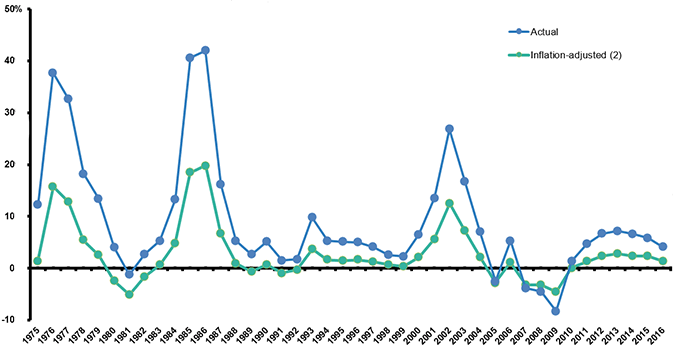
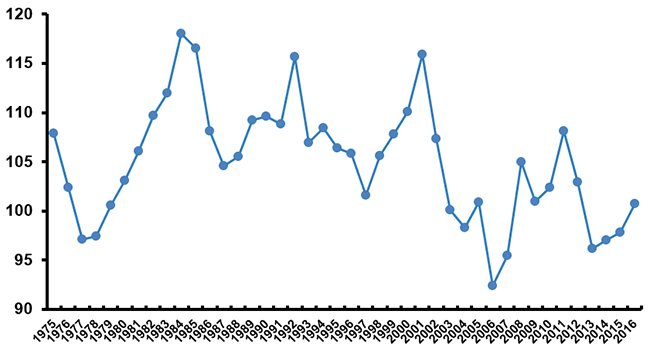
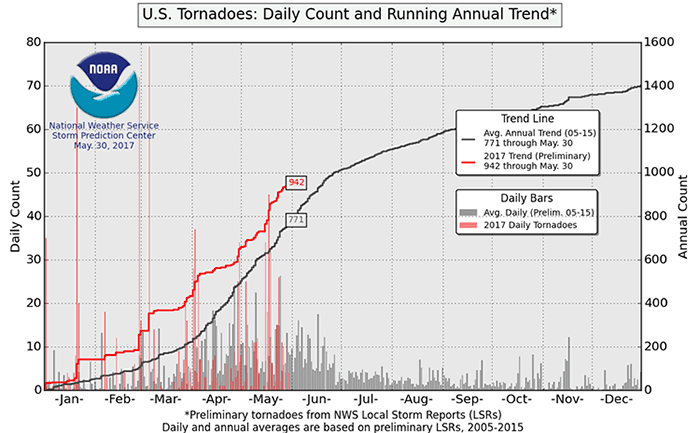
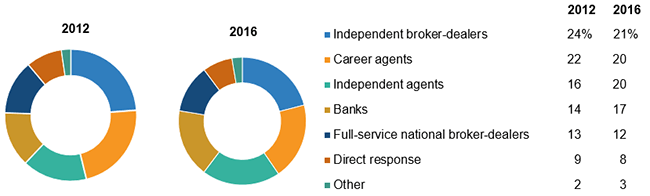
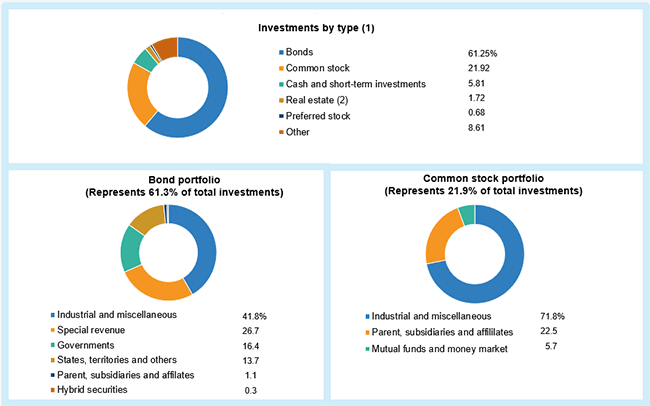
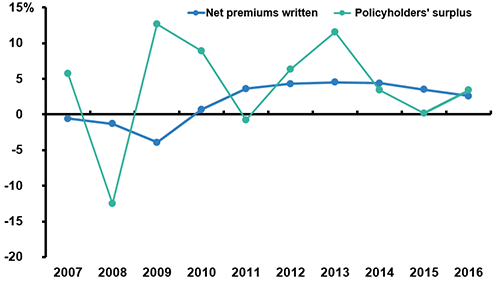
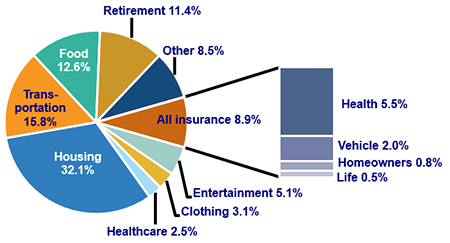
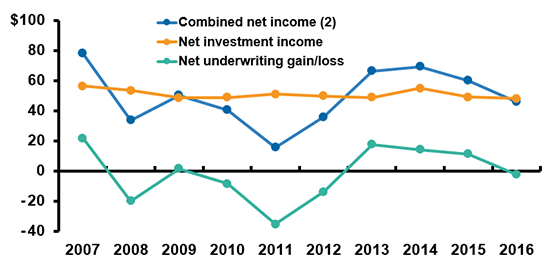
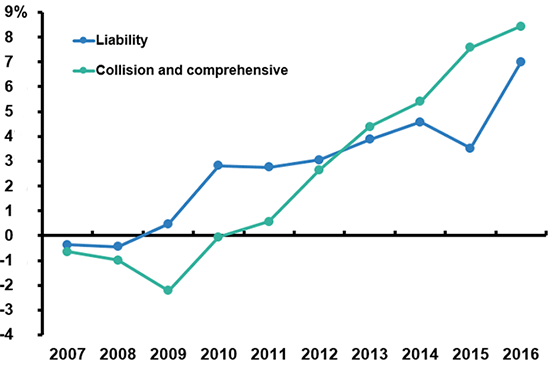
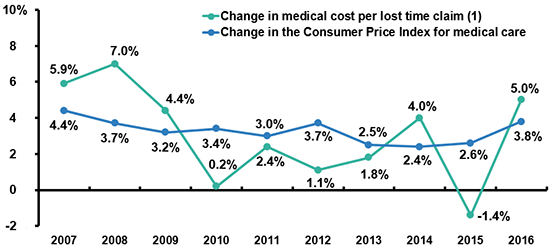
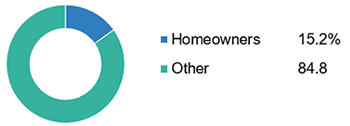
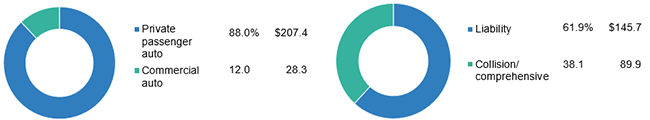

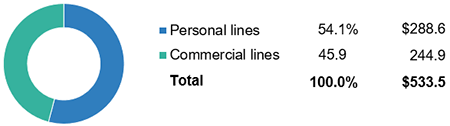
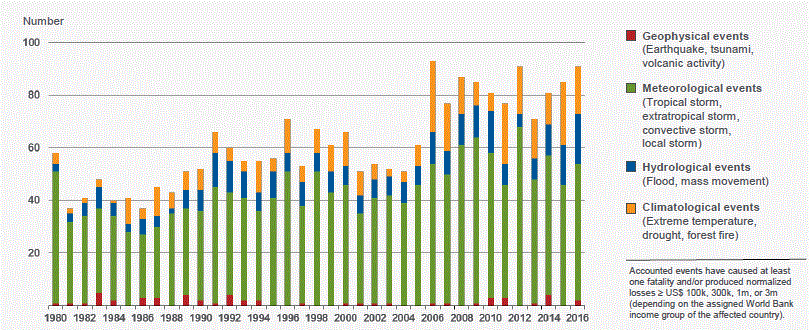
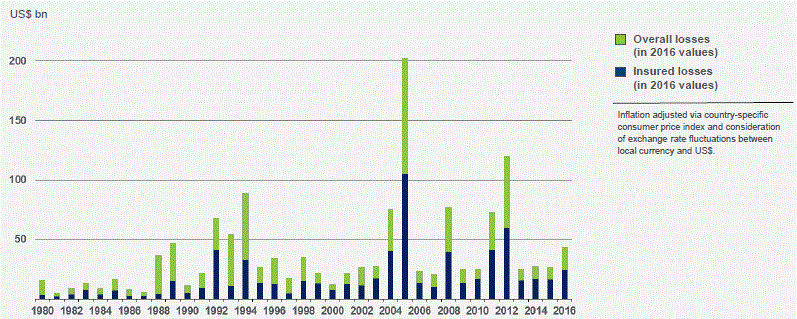
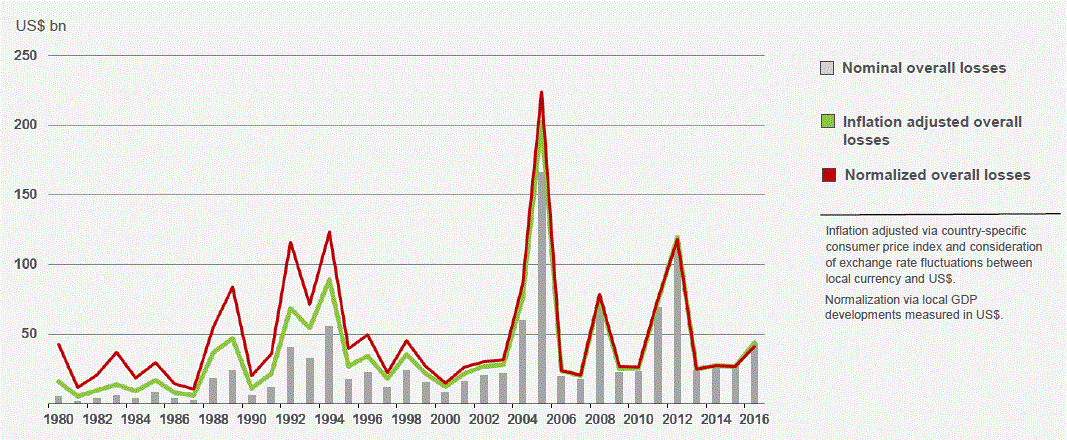
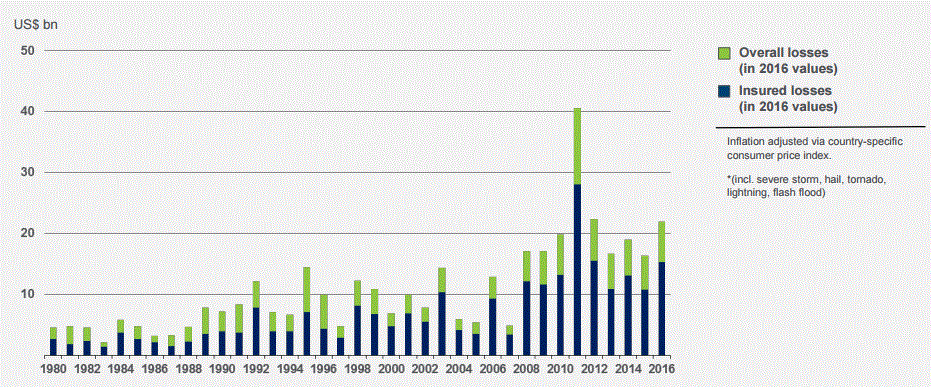
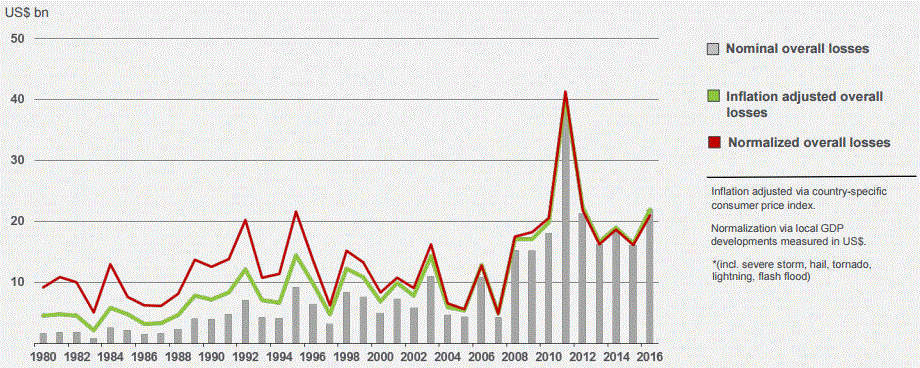
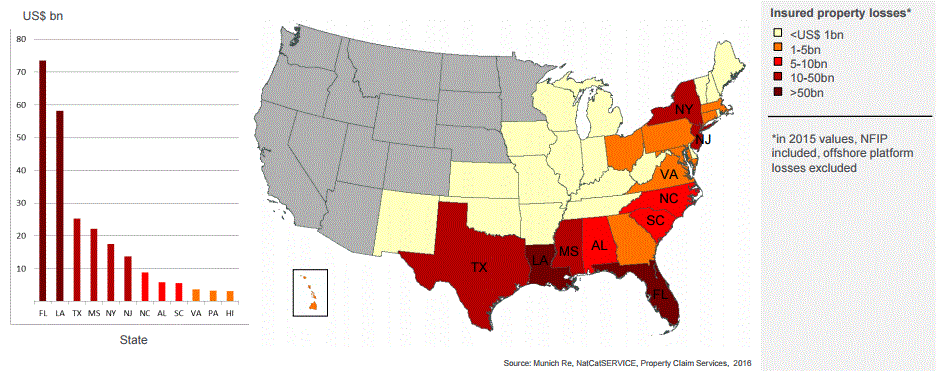
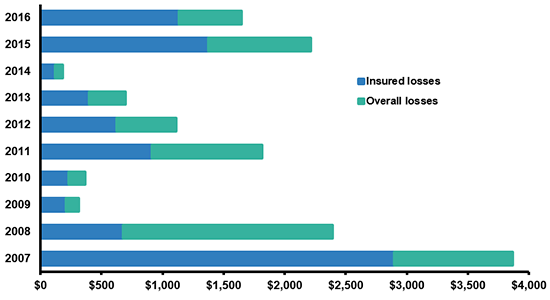
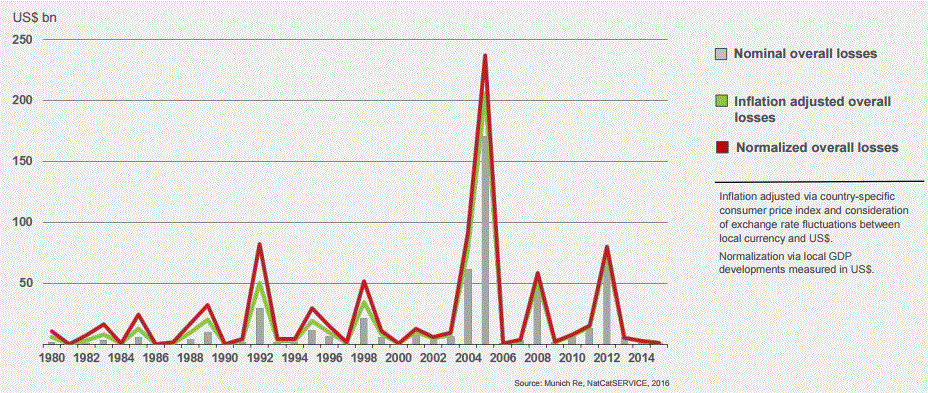
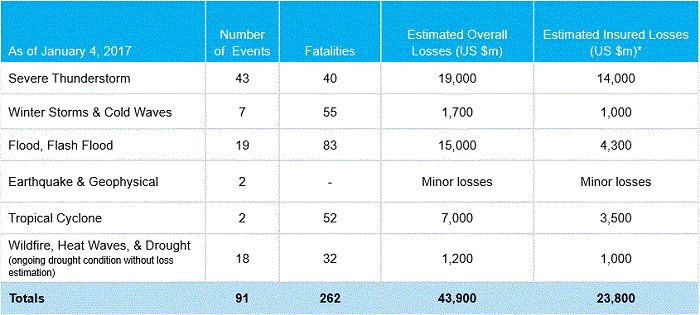
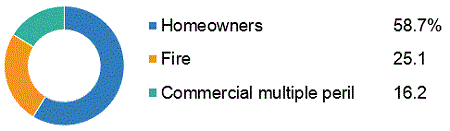
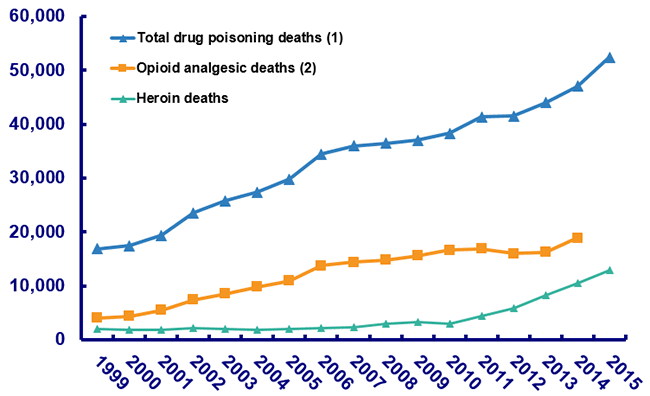
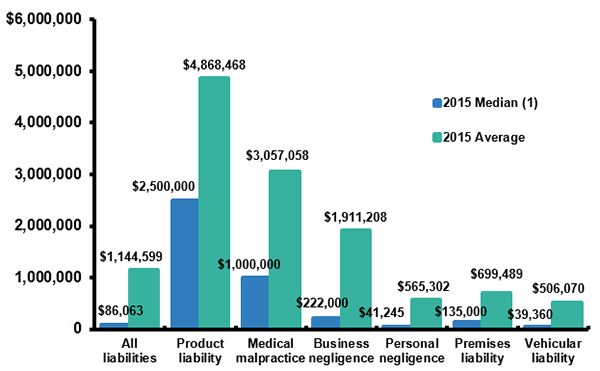
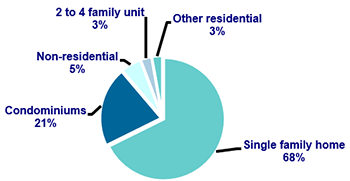


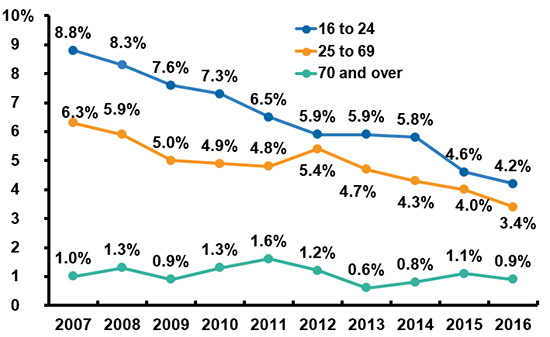

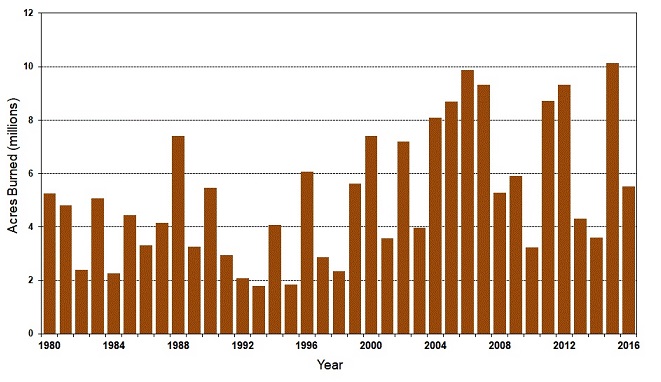


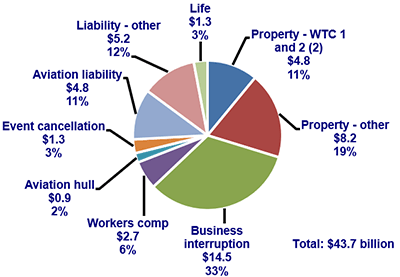
")


")

")


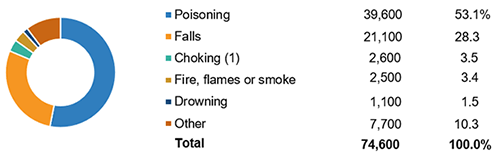


")


")
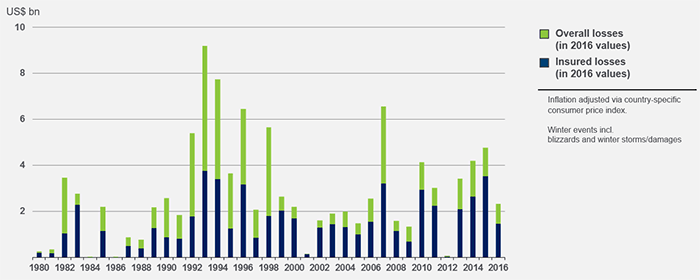
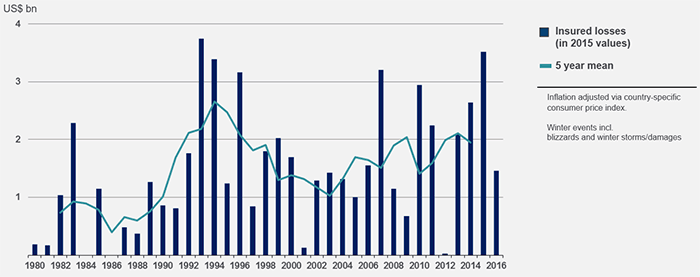


")
")


")

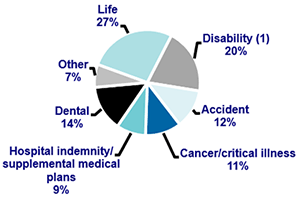


")
 Plan Balances, 2016")
")

")


")


")
")
")

")


")
")

")
 Plans, 2018")


")


")
")


")


")
")

")
")


")


")


")


")
 Plans, 2019")
")
")
")


")
")
")
")

")


")

")
")

")


")
")


")


")


")


")
")

")
")

")
")
")

")


")


")

")
")
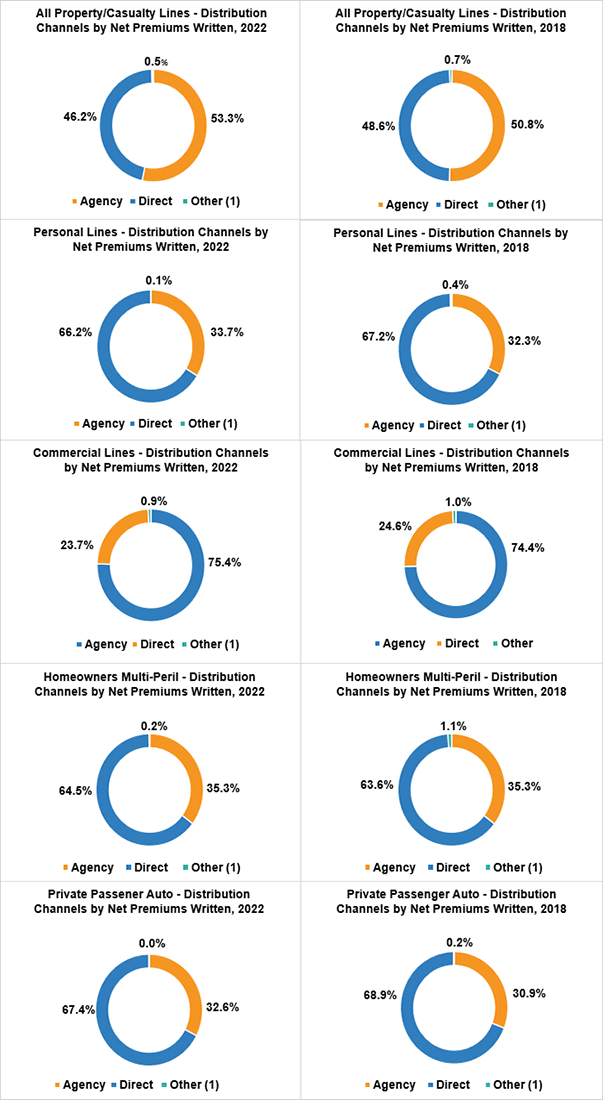
")

")


")


")
")


")


")
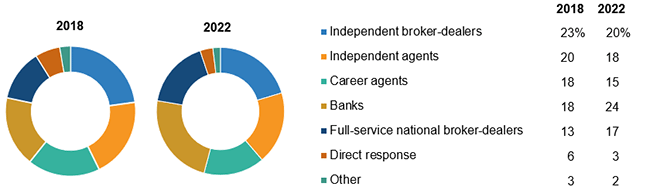
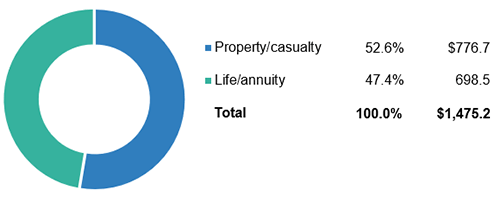
")
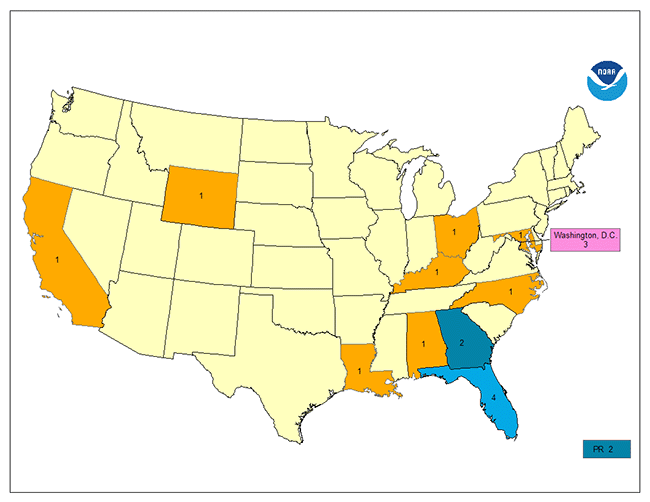
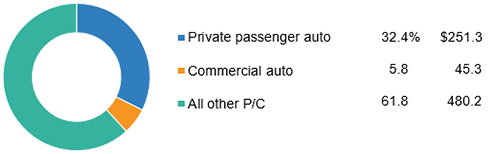
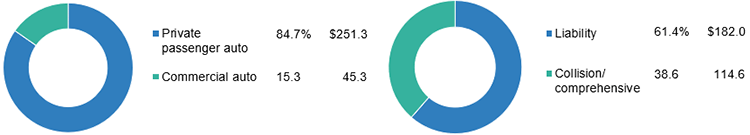

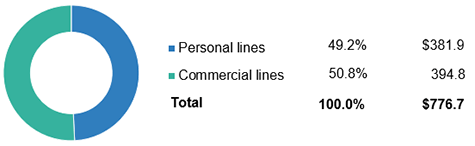
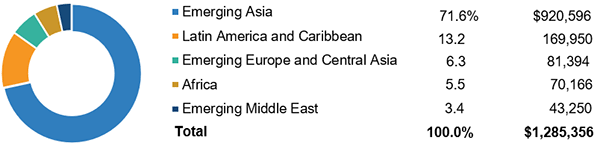
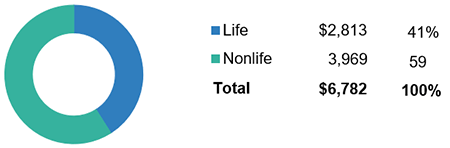
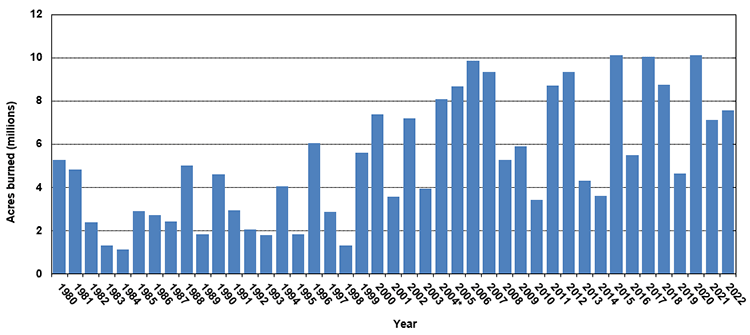
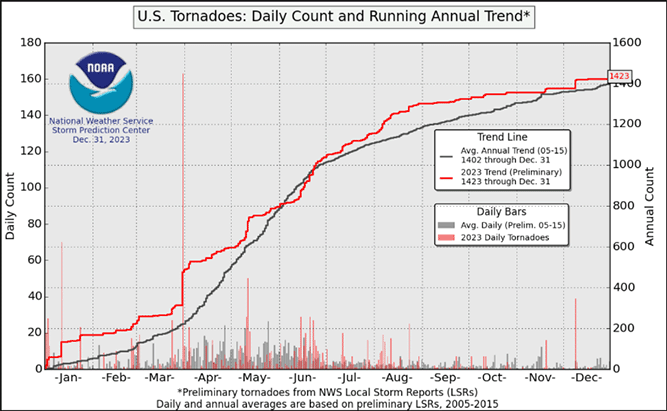
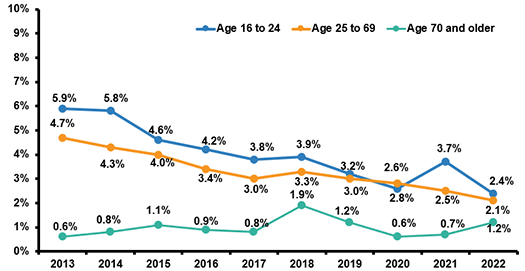
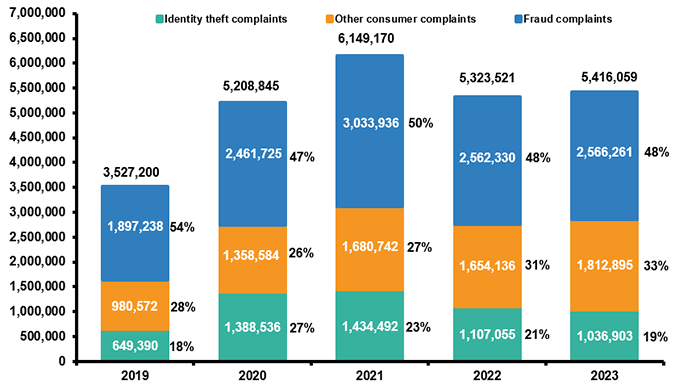
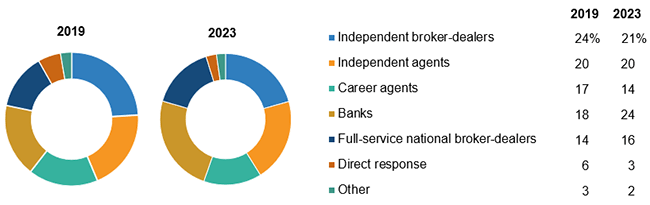
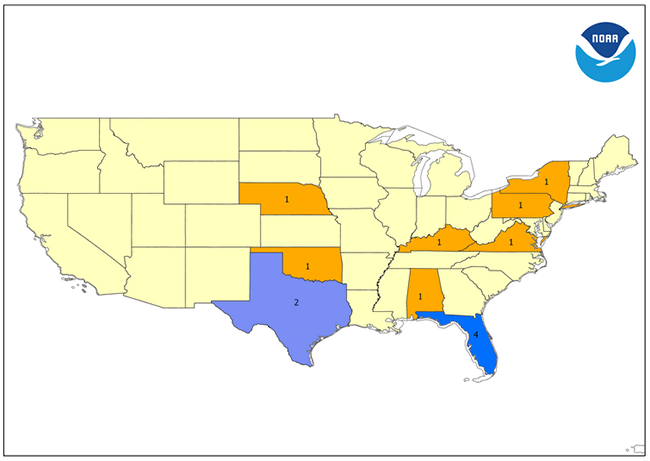
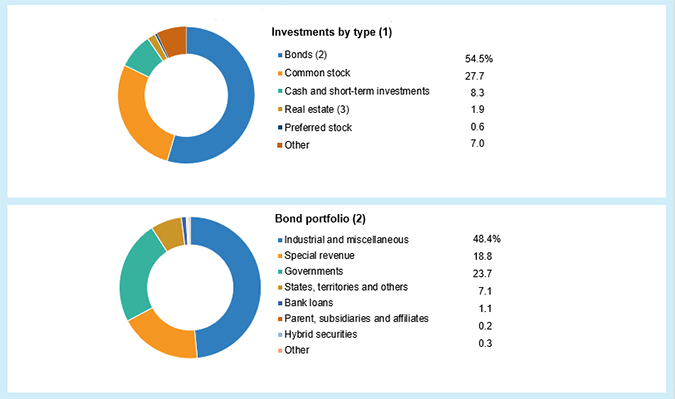
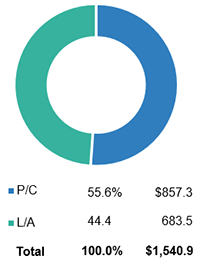
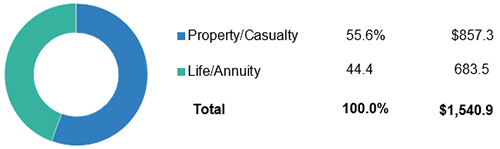
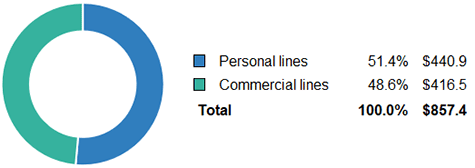
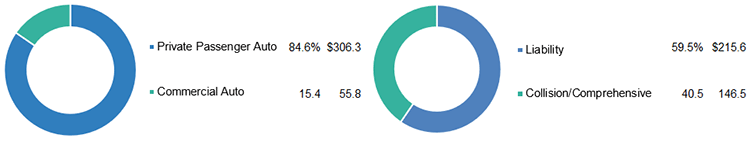
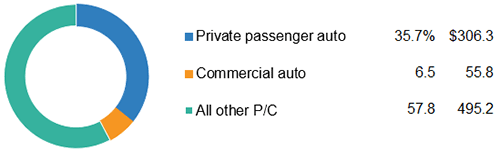
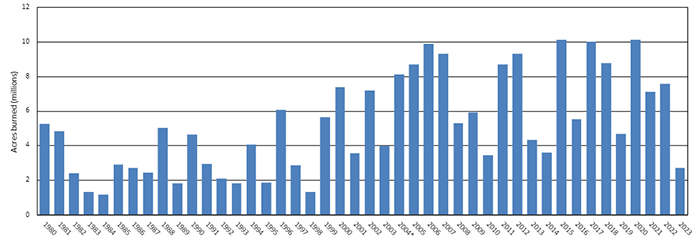

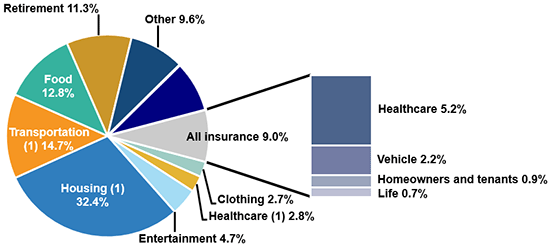
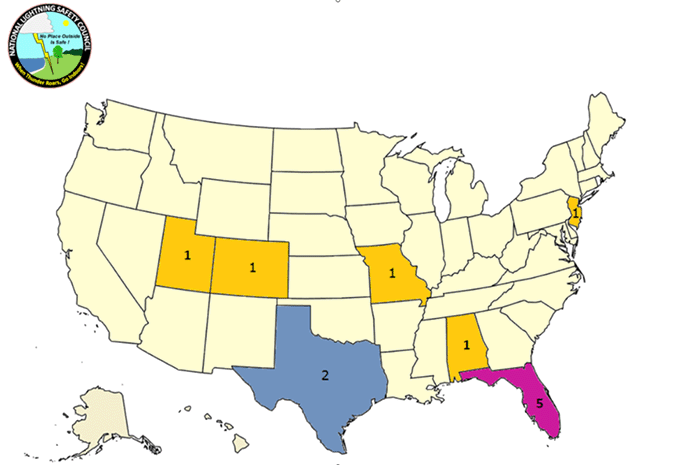
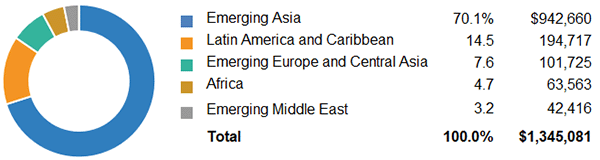
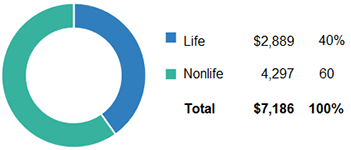