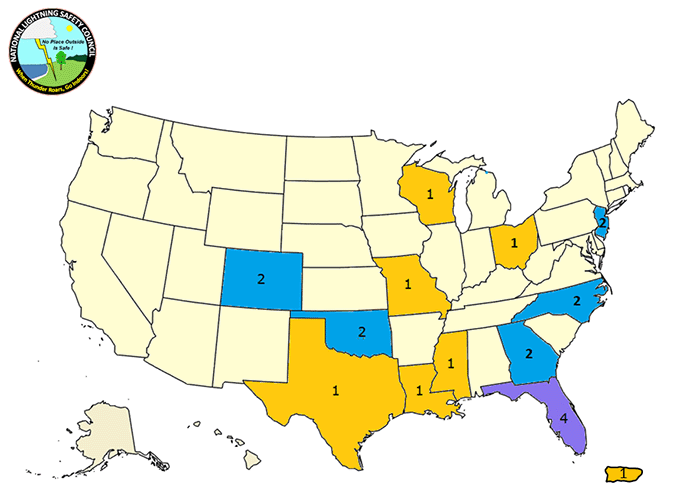
According to the National Weather Center and National Lightning Safety Council there were 21 direct lightning fatalities in 2025, compared to 14 in 2024. On average, based on data from 2016 to 2025, 20 people die each year from lightning strikes in the United States. The state with the most fatalities from lightning strikes is Florida.

Homeowners & Renters
Facts + Statistics: Lightning
Homeowners insurance losses
The number of lightning-caused U.S. homeowners insurance claims increased in 2025 over 2024 and is slightly below the five-year average.
In 2025, U.S. lightning–caused claims increased by 11.6 percent to 61,986 (from 55,537 in 2024), with numbers from the top ten claim states contributing to more than half of the total. National claim increased 59.4 percent (from $1.04 billion) to $1.65 billion. While the national average cost per claim was $26,616, the average was $60,382 in Texas.
For more information on lightning, please see The Lightning Protection Institute.
Related
View All