Facts + Statistics: Industry overview

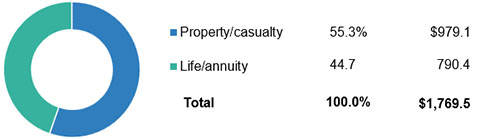
Employment In Insurance, 2016-2025
| Insurance carriers | Insurance agencies, brokerages and related services | |||||||
|---|---|---|---|---|---|---|---|---|
| Direct insurers (1) | ||||||||
| Year | Life and health (2) |
Property/ casualty |
Reinsurers | Total | Insurance agencies and brokers |
Other insurance- related activities (3) |
Total | Total industry |
| 2016 | 818.9 | 643.5 | 25.3 | 1,487.7 | 783.5 | 321.5 | 1,105.0 | 2,592.7 |
| 2017 | 850.4 | 639.7 | 26.6 | 1,516.7 | 809.6 | 333.3 | 1,142.9 | 2,659.6 |
| 2018 | 882.8 | 629.5 | 28.6 | 1,540.9 | 825.6 | 346.2 | 1,171.8 | 2,712.7 |
| 2019 | 931.2 | 650.3 | 28.6 | 1,610.1 | 842.8 | 349.5 | 1,192.2 | 2,802.3 |
| 2020 | 945.6 | 653.9 | 27.6 | 1,627.1 | 856.5 | 352.3 | 1,208.8 | 2,835.9 |
| 2021 | 908.7 | 646.9 | 28.1 | 1,583.7 | 886.6 | 354.5 | 1,241.2 | 2,824.9 |
| 2022 | 900.9 | 684.9 | 30.2 | 1,616.0 | 934.8 | 367.2 | 1,302.0 | 2,918.0 |
| 2023 | 907.9 | 679.7 | 30.8 | 1,618.4 | 966.6 | 384.3 | 1,351.0 | 2,969.3 |
| 2024 | 903.7 | 682.9 | 31.0 | 1,617.6 | 996.1 | 385.7 | 1,381.7 | 2,999.3 |
| 2025 (4) | 888.3 | 699.3 | 30.4 | 1,618.0 | 1,003.0 | 392.4 | 1,395.3 | 3,013.3 |
(1) Establishments primarily engaged in initially underwriting insurance policies.
(2) Includes establishments engaged in underwriting annuities, life insurance and health and medical insurance policies.
(3) Includes claims adjusters, third-party administrators of insurance funds and other service personnel such as advisory and insurance ratemaking services.
(4) Preliminary.
Source: U.S. Department of Labor, Bureau of Labor Statistics.
A property/casualty insurer must maintain a certain level of surplus to underwrite risks. This financial cushion is known as “capacity.” When the industry is hit by high losses, such as a major hurricane, capacity is diminished. It can be restored by increases in net income, favorable investment returns, reinsuring more risk, and/or raising additional capital.
Property/Casualty Insurance Industry Income Analysis, 2021-2025
| 2021 | 2022 | 2023 | 2024 | 2025 | |
|---|---|---|---|---|---|
| Net premiums written | $715.7 | $778.2 | $857.9 | $933.6 | $980.3 |
| Percent change | 9.1% | 8.7% | 10.2% | 8.8% | 5.0% |
| Premiums earned | $689.8 | $748.7 | $821.6 | $903.3 | $953.5 |
| Losses and loss adjustment expenses incurred | 500.7 | 569.8 | 627.3 | 641.0 | 634.8 |
| Other underwriting expenses | 188.6 | 199.8 | 213.8 | 235.9 | 251.1 |
| Policyholder dividends | 4.6 | 3.3 | 3.6 | 4.2 | 6.1 |
| Net underwriting gain/loss | -0.4 | -22.4 | -20.0 | 26.7 | 67.6 |
| Net investment income | 56.1 | 71.5 | 72.6 | 88.1 | 91.8 |
| Miscellaneous income/loss | 0.1 | -1.5 | -2.8 | -3.0 | -3.5 |
| Operating income | 54.6 | 47.9 | 50.2 | 111.9 | 154.5 |
| Realized capital gain | 17.5 | -3.9 | 48.1 | 79.3 | 17.3 |
| Federal income tax | 9.1 | 6.1 | 11.0 | 20.0 | 25.6 |
| Net income after taxes | 63.0 | 37.9 | 87.3 | 171.3 | 146.2 |
Source: NAIC data, sourced from S&P Global Market Intelligence: Income Statement; Insurance Information Institute.
Top 10 Writers Of Property/Casualty Insurance By Direct Premiums Written, 2025
| Rank | Group/company | Direct premiums written (1) | Market share (2) |
|---|---|---|---|
| 1 | State Farm | $115,149,861 | 10.5% |
| 2 | Progressive | 84,195,656 | 7.7 |
| 3 | Berkshire Hathaway Inc. | 63,597,581 | 5.8 |
| 4 | Allstate Corp. | 59,467,366 | 5.4 |
| 5 | Travelers | 43,124,331 | 3.9 |
| 6 | Liberty Mutual | 41,019,667 | 3.7 |
| 7 | USAA Insurance Group | 38,500,022 | 3.5 |
| 8 | Chubb Ltd. | 34,435,254 | 3.1 |
| 9 | Farmers Insurance Group | 29,586,855 | 2.7 |
| 10 | Zurich Insurance Group | 18,803,655 | 1.7 |
(1) Before reinsurance transactions, includes state funds.
(2) Based on U.S. total, excluding territories.
Source: NAIC data, sourced from S&P Global Market Intelligence, Insurance Information Institute.
Top 10 Writers Of Life/Annuity Insurance By Direct Premiums Written, 2025
| Rank | Group/company | Direct premiums written (1) | Market share (2) |
|---|---|---|---|
| 1 | MetLife Inc. | $114,534,965 | 9.3% |
| 2 | Equitable Holdings | 95,170,012 | 7.7 |
| 3 | New York Life Insurance Group | 76,120,380 | 6.2 |
| 4 | Athene Holding Ltd. | 54,287,584 | 4.4 |
| 5 | Prudential Financial Inc. | 47,609,525 | 3.9 |
| 6 | Massachusetts Mutual Life Insurance Co. | 44,580,803 | 3.6 |
| 7 | Nationwide | 42,844,641 | 3.5 |
| 8 | Pacific Life | 41,979,204 | 3.4 |
| 9 | Corebridge Financial Inc. | 39,089,278 | 3.2 |
| 10 | Western & Southern Financial Group | 38,781,454 | 3.1 |
(1) Includes life insurance, annuity considerations, deposit-type contract funds and other considerations; excludes accident and health insurance. Before reinsurance transactions.
(2) Based on U.S. total, excluding territories.
Source: NAIC data, sourced from S&P Global Market Intelligence, Insurance Information Institute.
Life/Annuity Insurance Income Statement, 2021-2025
| 2021 | 2022 | 2023 | 2024 | 2025 | Percent change, 2021-2025 (1) |
|
|---|---|---|---|---|---|---|
| Revenue | ||||||
| Life insurance premiums | $159.1 | $163.1 | $121.4 | $172.9 | $160.5 | -7.2% |
| Annuity premiums and deposits | 290.2 | 350.6 | 360.8 | 432.4 | 445.0 | 2.9 |
| Accident and health premiums | 188.1 | 165.1 | 176.0 | 191.2 | 191.7 | 0.3 |
| Other Premiums & Considerations | 6.0 | 7.3 | 0.8 | 1.0 | 0.8 | -19.3 |
| Total premiums, consideration and deposits | $643.3 | $686.0 | $659.0 | $797.5 | $798.0 | 0.1 |
| Net investment income | 208.3 | 205.5 | 225.8 | 249.5 | 266.5 | 6.8 |
| Reinsurance allowance | 8.4 | 38.2 | 28.6 | -8.0 | 92.6 | -1260.7 |
| Separate accounts revenue | 41.8 | 39.2 | 38.1 | 36.3 | 36.3 | 0.1 |
| Other income | 57.6 | 82.3 | 63.0 | 65.7 | 83.2 | 26.6 |
| Total revenue | $959.5 | $1,051.2 | $1,014.5 | $1,141.0 | $1,276.5 | 11.9 |
| Expense | ||||||
| Benefits | 343.4 | 305.6 | 325.1 | 350.3 | 365.0 | 4.2 |
| Surrenders | 367.5 | 353.0 | 416.2 | 484.2 | 487.2 | 0.6 |
| Increase in reserves | 89.3 | 131.5 | 67.9 | 107.3 | 134.7 | 25.5 |
| Transfers to separate accounts | -76.3 | -51.1 | -82.8 | -87.8 | -96.1 | 9.4 |
| Commissions | 65.2 | 67.8 | 77.5 | 79.5 | 85.5 | 7.5 |
| General and administrative expenses | 71.1 | 72.0 | 77.3 | 79.0 | 82.2 | 4.0 |
| Insurance taxes, licenses and fees | 10.1 | 9.7 | 10.0 | 11.0 | 10.9 | -0.2 |
| Other expenses | 15.0 | 61.7 | 35.7 | 46.0 | 128.5 | 179.7 |
| Total expenses | $885.2 | $950.2 | $926.9 | $1,069.5 | $1,197.9 | 12.0 |
| Net income | ||||||
| Policyholder dividends | 18.4 | 20.3 | 22.8 | 24.4 | 26.0 | 6.5 |
| Net gain from operations before federal income tax | 55.9 | 58.3 | 64.7 | 47.1 | 52.6 | 11.6 |
| Federal income tax | 8.2 | 7.9 | 12.5 | 8.0 | 6.6 | -17.0 |
| Net income before capital gains | $47.7 | $49.9 | $52.2 | $39.1 | $46.0 | 17.4 |
| Net realized capital gains (losses) | -7.6 | -10.2 | -15.3 | -5.8 | -6.3 | 7.6 |
| Net income | $40.1 | $39.3 | $36.9 | $33.3 | $39.7 | 19.1 |
| Pre-tax operating income | 55.9 | 58.3 | 64.7 | 47.1 | 52.6 | 11.6 |
| Capital and surplus, end of year | 499.7 | 489.5 | 513.0 | 523.1 | 552.2 | 5.6 |
(1) Calculated from unrounded data.
(2) The NAIC introduced changes for the Analysis of Operations and Analysis of Increase in Reserves exhibits for 2019 and future periods.
Source: NAIC data, sourced from S&P Global Market Intelligence, Insurance Information Institute.
Related
View All
Facts + Statistics: Catastrophe bonds and other insurance-linked securities

Facts + Statistics: Distribution channels

Facts + Statistics: Insurance company rankings