Sorry, you need to enable JavaScript to visit this website.

Facts + Statistics: Wildfires

Key Facts

  • According to federal data cited by the National Park Service, humans cause about 85 percent of all wildfires yearly in the United States.
  • The Annual 2022 Wildfires Report from the National Centers for Environmental Information indicates that over 7.5 million acres of wildland were consumed by fire that year.
  • According to the National Interagency Fire Center, California leads the country with the most wildfires and Oregon leads with the most acres burned. California-specific charts below on the Top 10 largest, most destructive, and deadliest wildfires.

Annual Number of Acres Burned in Wildland Fires, 1980-2024


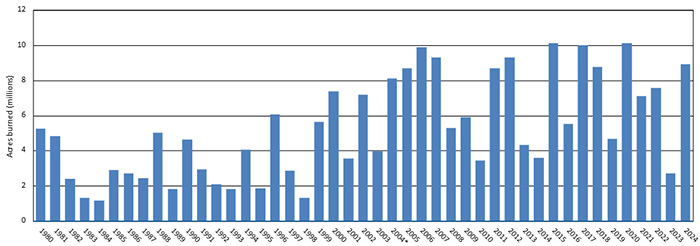
*2004 fires and acres do not include state lands for North Carolina.

Source: National Interagency Fire Center.

View Archived Graphs

Wildfires By State, 2024


State Number of fires Number of acres burned
Alabama 1,525 20,978
Alaska 377 667,075
Arizona 2,191 282,989
Arkansas 1,219 25,444
California 8,316 1,081,144
Colorado 894 60,539
Connecticut 356 339
Delaware 23 137
District of Columbia 0 0
Florida 2,348 65,618
Georgia 2,492 11,896
Hawaii 90 452
Idaho 1,450 996,762
Illinois 47 441
Indiana 64 154
Iowa 362 3,965
Kansas 41 22,217
Kentucky 957 24,448
Louisiana 385 9,058
Maine 653 295
Maryland 174 965
Massachusetts 1,299 4,622
Michigan 447 2,062
Minnesota 1,123 15,125
Mississippi 1,800 55,880
Missouri 2,804 95,095
Montana 2,323 352,491
Nebraska 1,035 113,850
Nevada 929 70,410
New Hampshire 130 127
New Jersey 1,443 12,449
New Mexico 823 82,531
New York 125 6,496
North Carolina 4,668 18,233
North Dakota 935 173,237
Ohio 1,107 2,441
Oklahoma 3,041 383,592
Oregon 2,232 1,797,796
Pennsylvania 1,448 3,792
Puerto Rico 0 0
Rhode Island 73 75
South Carolina 50 634
South Dakota 675 35,809
Tennessee 596 7,771
Texas 4,967 1,314,903
Utah 1,211 90,417
Vermont 97 180
Virginia 742 56,372
Washington 1,806 275,593
West Virginia 1,104 55,309
Wisconsin 1,162 2,597
Wyoming 738 620,069
United States (1) 64,897 8,924,884

(1) Totals for the United States do not match totals shown elsewhere by the National Interagency Fire Center due to the use of different exhibits.

Source: National Interagency Fire Center.

View Archived Tables

Homes At Risk For Extreme Wildfires, By State, 2025


Rank State Number of housing units
1 California 1,257,966
2 Colorado 318,783
3 Texas 243,136
4 Oregon 128,007
5 Arizona 123,906
6 New Mexico 117,875
7 Idaho 105,714
8 Montana 90,494
9 Utah 67,367
10 Washington 59,585
11 South Dakota 27,326
12 Nevada 21,744
13 Wyoming 16,243
14 Oklahoma 2,071

Source: Cotality®, a property data and analytics company.

View Archived Tables

Top 10 States For Wildfires Ranked By Number Of Fires And By Number Of Acres Burned, 2024


Rank State Number of fires Rank State Number of acres burned
1 California 8,316 1 Oregon 1,797,796
2 Texas 4,967 2 Texas 1,314,903
3 North Carolina 4,668 3 California 1,081,144
4 Oklahoma 3,041 4 Idaho 996,762
5 Missouri 2,804 5 Alaska 667,075
6 Georgia 2,492 6 Wyoming 620,069
7 Florida 2,348 7 Oklahoma 383,592
8 Montana 2,323 8 Montana 352,491
9 Oregon 2,232 9 Arizona 282,989
10 Arizona 2,191 10 Washington 275,593

Source: National Interagency Fire Center.

View Archived Tables

Top 10 Costliest Wildland Fires In The United States (1)

($ millions)

      Estimated insured loss
Rank Year Name Dollars when occurred In 2024 dollars (2)
1 2018 Camp Fire $10,000 $12,524
2 2017 Tubbs Fire 8,700 11,134
3 2018 Woolsey Fire 4,200 5,260
4 2023 Maui Wildfire (Hawaii) 4,300 4,421
5 1991 Oakland Fire (Tunnel) 1,700 3,906
6 2017 Atlas Fire 3,000 3,839
7 2020 Glass Fire 2,950 3,578
8 2020 CZU Lightning Complex Fire 2,500 3,032
9 2017 Thomas Fire 2,250 2,881
10 2021 Marshall Fire (Colorado) 2,500 2,831

(1) Includes losses sustained by private insurers and government-sponsored programs such as the National Flood Insurance Program. All fires on this list occurred in California unless otherwise noted. Includes Puerto Rico and the U.S. Virgin Islands. Subject to change as loss estimates are further developed. As of January 2025.
(2) Adjusted for inflation by Aon using the U.S. Consumer Price Index.

Source: Aon.

View Archived Tables

Top 10 Largest California Wildfires (1)


Rank Fire name (cause) Date County Acres Structures Deaths
1 August Complex (Lightning) August 2020 Mendocino, Humboldt, Trinity,
Tehama, Glenn, Lake, & Colusa
1,032,648 935 1
2 Dixie (Powerlines) July 2021 Butte, Plumas, Lassen, Shasta & Tehama 963,309 1,311 1
3 Mendocino Complex (Human Related) July 2018 Colusa, Lake, Mendocino & Glenn 459,123 280 1
4 Park Fire (Arson) July 2024 Butte, Plumas, Shasta & Tehama 429,603 709 0
5 SCU Lightning Complex (Lightning) August 2020 Stanislaus, Santa Clara, Alameda, Contra
Costa, & San Joaquin
396,625 225 0
6 Creek (Undetermined) September 2020 Fresno & Madera 379,895 858 0
7 LNU Lightning Complex (Lightning/Arson) August 2020 Napa, Solano, Sonoma, Yolo, Lake, & Colusa 363,220 1,491 6
8 North Complex (Lightning) August 2020 Butte, Plumas & Yuba 318,935 2,352 15
9 Thomas (Powerlines) December 2017 Ventura & Santa Barbara 281,893 1,060 2
10 Cedar (Human Related) October 2003 San Diego 273,246 2,820 15

(1) As of October 2024.

Source: Calfire.

View Archived Tables

Top 10 Most Destructive California Wildfires (1)


Rank Fire name and cause Date County Acres Structures (2) Deaths
1 Camp Fire (Powerlines) November 2018 Butte 153,336 18,804 85
2 Eaton (3) January 2025 Los Angeles 14,021 9,413 18
3 Palisades (3) January 2025 Los Angeles 23,707 6,833 12
4 Tubbs (Electrical) October 2017 Napa & Sonoma 36,807 5,636 22
5 Tunnel - Oakland Hills (Rekindle) October 1991 Alameda 1,600 2,900 25
6 Cedar (Human related) October 2003 San Diego 273,246 2,820 15
7 North Complex (Lightning) August 2020 Butte, Plumas & Yuba 318,935 2,352 15
8 Valley (Electrical) September 2015 Lake, Napa and Sonoma 76,067 1,958 4
9 Witch (Powerlines) October 2007 San Diego 197,990 1,650 2
10 Woolsey (Electrical) November 2018 Ventura 96,949 1,643 3

(1) As of April 2025.
(2) "Structures" include homes, outbuildings (barns, garages, sheds, etc) and commercial properties destroyed. This list does not include fire jurisdiction. These are the Top 20 regardless of whether they were state, federal, or local responsibility.
(3) Under investigation.

Source: Calfire.

View Archived Tables

Top 10 Deadliest California Wildfires (1)


Rank Fire Name and Cause Date County Acres Structures Deaths
1 Camp Fire (Power lines) November 2018 Butte  153,336 18,804 85
2 Griffith Park (Unknown) October 1933 Los Angeles 47 0 29
3 Tunnel - Oakland Hills (Rekindle) October 1991 Alameda 1,600 2,900 25
4 Tubbs (Electrical) October 2017 Napa & Sonoma 36,807 5,643 22
5 Eaton (2) January 2025 Los Angeles 14,021 9,413 18
6 North Complex (Lightning) August 2020 Butte, Plumas & Yuba 318,935 2,352 15
7 Cedar (Human related) October 2003 San Diego 273,246 2,820 15
8 Rattlesnake (Arson) July 1953 Glenn 1,340 0 15
9 Palisades (2) January 2025 Los Angeles 23,707 6,833 12
10 Loop (Unknown) November 1966 Los Angeles 2,028 0 12

(1) As of April 2025.
(2) Under investigation.

Source: Calfire.

View Archived Tables

Back to top

Catastrophes
Spotlight on: Catastrophes - Insurance issues
Catastrophes | Homeowners
Background on: Wildfires
Disasters + Preparedness
Insurance for wildfires
Disasters + Preparedness
Wildfires: insurance and recovery resources