Sorry, you need to enable JavaScript to visit this website.

Facts + Statistics: Highway safety

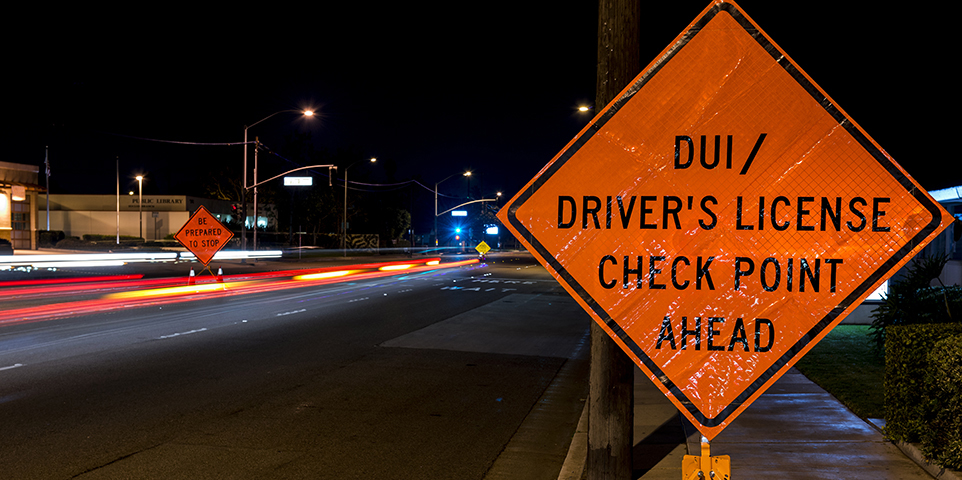
The cost of auto insurance can be affected by the vehicle's cost and crashworthiness (the degree to which it can protect occupants from the effects of an accident) and by the driver's safety habits. Insurers support raising awareness about safe driving practices, such as seatbelt usage and avoiding driving while under the influence of alcohol. These initiatives reinforce public safety and help to reduce costs for policyholders and insurers.

Traffic Deaths, 2014-2023


Year Fatalities Annual
percent
change
Fatality rate
per 100 million
vehicle miles
traveled
Fatality rate
per 100,000
registered vehicles
2014 32,744 -0.5% 1.08 11.92
2015 35,484 8.4 1.15 12.61
2016 37,806 6.5 1.19 13.13
2017 37,473 -0.9 1.17 12.91
2018 36,835 -1.7 1.14 12.40
2019 36,355 -1.3 1.11 12.15
2020 39,007 7.3 1.34 13.13
2021 43,230 10.8 1.38 14.28
2022 42,514 -1.7 1.30 14.01
2023 (1) 40,990 -3.6 1.26 NA

(1) Estimate.

NA=Data not available.

Source: U.S. Department of Transportation, National Highway Traffic Safety Administration.

View Archived Tables


Motor Vehicle Traffic Deaths by State, 2021-2022


  Number of deaths   Number of deaths
State 2021 2022 Percent
change
State 2021 2022 Percent
change
Alabama 983 988 1% Montana 239 213 -11%
Alaska 70 82 17 Nebraska 221 244 10
Arizona 1,192 1,302 9 Nevada 385 416 8
Arkansas 692 643 -7 New Hampshire 118 146 24
California 4,513 4,428 -2 New Jersey 692 685 -1
Colorado 691 764 11 New Mexico 483 466 -4
Connecticut 303 359 18 New York 1,156 1,175 2
Delaware 136 162 19 North Carolina 1,693 1,630 -4
D.C. 41 32 -22 North Dakota 101 98 -3
Florida 3,741 3,530 -6 Ohio 1,354 1,275 -6
Georgia 1,809 1,797 -1 Oklahoma 762 710 -7
Hawaii 94 116 23 Oregon 599 601 0
Idaho 273 215 -21 Pennsylvania 1,230 1,179 -4
Illinois 1,334 1,268 -5 Rhode Island 63 52 -17
Indiana 932 949 2 South Carolina 1,198 1,094 -9
Iowa 356 338 -5 South Dakota 148 137 -7
Kansas 423 410 -3 Tennessee 1,327 1,314 -1
Kentucky 806 744 -8 Texas 4,500 4,408 -2
Louisiana 971 906 -7 Utah 332 319 -4
Maine 153 182 19 Vermont 74 76 3
Maryland 563 564 0 Virginia 973 1,008 4
Massachusetts 413 434 5 Washington 674 733 9
Michigan 1,137 1,124 -1 West Virginia 282 264 -6
Minnesota 488 444 -9 Wisconsin 620 596 -4
Mississippi 766 703 -8 Wyoming 110 134 22
Missouri 1,016 1,057 4 United States 43,230 42,514 -2%

Source: U.S. Department of Transportation, National Highway Traffic Safety Administration.

View Archived Tables

Drivers In Fatal Motor Vehicle Crashes By Age, 2022


  Licensed drivers   Drivers in fatal
crashes
 
Age group Number Percent of
total drivers
Number Involvement
rate (1)
16 to 20 11,661,426 5.0% 4,856 41.22
21 to 24 14,288,708 6.1 5,279 36.95
25 to 34 40,817,284 17.4 12,611 30.90
35 to 44 40,101,137 17.1 10,344 25.79
45 to 54 37,360,131 15.9 8,619 23.07
55 to 64 39,215,895 16.7 7,899 20.14
65 to 74 31,558,393 13.4 5,053 16.01
Over 74 19,965,210 8.5 3,445 17.26
Total (2) 235,086,153 100.0% 60,048 25.54

(1) Per 100,000 licensed drivers in each age group.
(2) Includes drivers under the age of 15 and of unknown age.

Source: U.S. Department of Transportation, National Highway Traffic Safety Administration; Federal Highway Administration.

View Archived Tables


View Archived Graphs

Driving Behaviors Reported For Drivers And Motorcycle Operators Involved In Fatal Crashes, 2022


Behavior Number (1) Percent
Driving too fast for conditions or in excess of posted limit or racing 11,103 18.5%
Under the influence of alcohol, drugs, or medication 6,594 11.0
Operating vehicle in a careless manner 5,319 8.9
Failure to yield right of way 4,432 7.4
Failure to keep in proper lane 3,420 5.7
Distracted (phone, talking, eating, object, etc.) 3,124 5.2
Operating vehicle in erratic, reckless or negligent manner 2,251 3.7
Failure to obey traffic signs, signals, or officer 2,541 4.2
Overcorrecting/oversteering 1,708 2.8
Vision obscured (rain, snow, glare, lights, building, trees, etc.) 1,542 2.6
Drowsy, asleep, fatigued, ill, or blacked out  1,264 2.1
Swerving or avoiding due to wind, slippery surface, etc. 1,334 2.2
Driving wrong way on one-way traffic or wrong side of road 1,282 2.1
Making improper turn 485 0.8
Other factors 6,017 10.0
None reported 8,492 14.1
Unknown 20,263 33.7
Total drivers (2) 60,048 100.0%

(1) Number of drivers and motorcycle operators.
(2) The sum of the numbers and percentages is greater than total drivers as more than one factor may be present for the same driver. Beginning in 2022, operators and passengers of motorized bicycles are captured as pedal cyclists when involved in a motor vehicle traffic crash.

Source: U.S. Department of Transportation, National Highway Traffic Safety Administration.

View Archived Tables

Fatal Crashes By First Harmful Event, Type Of Collision, 2021

Type of collision Number Percent of total
fatal crashes
Collision with moving motor vehicle    
Angle 7,183 18.2
Rear end 2,949 7.5
Sideswipe 1,184 3.0
Head on 4,295 10.9
Other/unknown 188 0.5
     Total 15,799 40.0%
Collision with fixed object    
Pole/post 1,593 4.0
Culvert/curb/ditch 2,838 7.2
Shrubbery/tree 2,714 6.9
Guard rail 1,036 2.6
Embankment 921 2.3
Bridge 237 0.6
Other/unknown 2,079 5.3
     Total 11,418 28.9%
Collision with object, not fixed    
Parked motor vehicle 538 1.4
Animal 156 0.4
Pedestrian 6,790 17.2
Pedalcyclist 959 2.4
Train 92 0.2
Other/unknown 481 1.2
     Total 9,016 22.8%
Noncollision    
Rollover 2,825 7.2
Other/unknown 408 1.0
     Total 3,233 8.2%
Total 39,508(1)  100.0%

(1) Includes 42 fatal crashes with unknown first harmful events.

Source: U.S. Department of Transportation, National Highway Traffic Safety Administration.

View Archived Tables

Holiday Driving, 2017-2021 (1)


  Holiday period (1)
  New Year’s Day Memorial Day Independence Day Labor Day Thanksgiving Day Christmas Day
Year Deaths Percent
alcohol-
impaired (2)
Deaths Percent
alcohol-
impaired (2)
Deaths Percent
alcohol-
impaired (2)
Deaths Percent
alcohol-
impaired (2)
Deaths Percent
alcohol-
impaired (2)
Deaths Percent
alcohol-
impaired (2)
2017 330 37% 345 37% 529 38% 345 37% 470 36% 299 38%
2018 325 39 430 38 175 41 433 36 433 31 425 35
2019 428 36 453 37 498 39 438 39 413 29 136 37
2020 145 52 396 41 480 41 510 38 504 36 323 39
2021 395 40 453 40 517 39 506 41 514 36 376 36

(1) The length of the holiday period depends on the day of the week on which the holiday falls. Memorial Day and Labor Day are always 3.25 days; Thanksgiving is always 4.25 days; and New Year’s Day, Independence Day, and Christmas are 3.25 days
if the holiday falls on Friday through Monday, 4.25 days if on Tuesday or Thursday, and 1.25 days if on Wednesday. See https://injuryfacts.nsc.org/motor-vehicle/holidays/holiday-introduction/ for more information.
(2) The highest blood alcohol concentration (BAC) among drivers or motorcycle riders involved in the crash was 0.08 grams per deciliter (g/dL) or higher (the legal definition of drunk driving in most states).

Source: National Safety Council based on National Highway Traffic Safety Administration data.

View Archived Tables

Motor Vehicle Crash Deaths By Month, 2021

Month Deaths Percent of total Rank
January 2,835 7% 11
February 2,340 6 12
March 2,901 7 10
April 3,271 8 8
May 3,435 9 6
June 3,466 9 5
July 3,562 9 4
August 3,715 9 2
September 3,623 9 3
October 3,799 10 1
November 3,320 8 7
December 3,241 8 9
Total 39,508 100%  

Source: U.S. Department of Transportation, National Highway Traffic Safety Administration.

View Archived Tables

Fatal Crashes Involving Distracted Drivers, 2022


  Crashes Drivers Fatalities
Total fatal crashes 39,221 60,048 42,514
Distraction-affected fatal crashes      
Number of distraction-affected fatal crashes 3,047 3,124 3,308
Percent of total fatal crashes 8% 5% 8%
Cellphone in use in distraction-affected fatal crashes      
Number of cellphone distraction-affected fatal crashes 368 375 402
Percent of fatal distraction-affected crashes 12% 12% 12%

Source: U.S. Department of Transportation, National Highway Traffic Safety Administration.

View Archived Tables


Additional resources

Background

Background on: Teen drivers

Background on: Older drivers

Background on: Distracted driving

Facts + Statistics

Drowsy driving

Aggressive driving

Distracted driving

Teen drivers

IIHS Highway Safety Topics

NHTSA Traffic Safety Fact Sheets

NHTSA Crash Stats

Back to top

Auto
Background on: Alcohol-impaired driving
Auto
Background on: Marijuana and impaired driving
Auto
Background on: Motorcycle crashes